文章信息
- 黄志, 高天宇, 赵西萌, 王凤, 杨光, 王斌, 徐振强, 胡敏, 曾立民, 张剑波
- HUANG Zhi, GAO Tianyu, ZHAO Ximeng, WANG Feng, YANG Guang, WANG Bin, XU Zhenqiang, HU Min, ZENG Limin, ZHANG Jianbo
- 2006-2014年北京夏季大气中PANs浓度变化趋势
- Trends of Summertime Ground-Level Peroxyacyl Nitrates Concentrations in Beijing, China from 2006 to 2014
- 北京大学学报(自然科学版), 2016, 52(3): 528-534
- Acta Scientiarum Naturalium Universitatis Pekinensis, 2016, 52(3): 528-534
-
文章历史
- 收稿日期: 2015-03-11
- 修回日期: 2015-05-22
- 网络出版日期: 2016-05-17
过氧酰基硝酸酯类物质PANs (peroxyacyl nitra-tes, 通式RC (O) OONO2)是大气中氮氧化物(ni-trogen oxides, NOx=NO+NO2)和挥发性有机化合物(volatile organic compounds, VOCs)光化学反应体系重要的二次污染物, 没有直接的人为排放, 是大气光化学污染的重要指示剂, 在局地、区域、洲际甚至全球对流层大气化学中都扮演着重要角色[1-3]。其中, 过氧乙酰硝酸酯(peroxyacetyl nitrate, PAN, R=CH3)与过氧丙酰硝酸酯(peroxypropionyl nitra te, PPN, R=CH3CH2)是最主要的物质, 在大气中的含量最高[4]。PAN是刺激物、诱变剂、染色体断裂剂和植物毒素[5], 高浓度的PAN对植物生长、人体健康具有重要影响[6]。PAN是对流层NOx的重要储库[7], 它在低温条件下稳定, 能随气团进行远距离输送并通过热分解产生NO2, 由此影响对流层主要氧化剂臭氧和OH自由基的分布, 从而影响不同地区的大气光化学污染水平[8]。
自20世纪50年代从美国洛杉矶地区出现的光化学烟雾中发现PAN[9]以来, PAN的监测在世界各地展开, 已证实广泛存在于对流层大气中[1, 10-11]。国内也相继在北京[12-21]、甘肃兰州[22]、青海瓦里关[22]、上海浦东[23]、广东后花园[24]、广东鹤山[25]、福建厦门[26]等地进行监测, 但是, 这些监测较分散且持续时间不长, 只能反映当时的浓度水平, 缺少年际间的长期观测, 难以揭示其浓度的变化趋势。
北京作为中国的首都, 自“十一五”规划(2006-2010)以来, 在经济建设取得巨大成就的同时, 也面临着严峻的环境问题, 其中大气光化学污染问题比较突出。为实现可持续发展, “十一五”和“十二五”期间, 北京市先后制定《北京市“十一五”期间环境保护和生态建设规划》和《北京市“十二五”时期环境保护和建设规划》, 采取一系列措施控制氮氧化物、挥发性有机化合物, 如在全国率先实施更为严格的机动车国五排放标准、淘汰高污染排放的老旧机动车、实施家具行业和汽车制造行业油漆喷涂工艺的技术改造等[27]。
北京位于华北平原西北边缘, 三面环山, 地势西北高、东南低。受地形和气象条件的影响, 大气污染物容易积累。北京这样的超大城市发生光化学污染是本地污染排放和区域污染输送共同作用的结果。夏季是北京地区光学污染最严重的季节[20]。为评估近些年来北京在治理光化学污染方面采取的控制措施的效果, 本研究组从2006年至2014年(2010年除外, 下同)夏季对北京大气中PANs浓度进行了长期观测。本文结合NOx和O3等其他大气污染物浓度数据, 揭示光化学污染主要产物浓度变化趋势, 为以后区域大气污染的联防联控措施的制定提供参考依据。
1 监测站点及监测仪器2006-2014年夏季8月, 在北京大学校区(北大站点)对PANs浓度进行监测。北京大学位于北京市区西北方向中关村附近, 该地区人员集中, 交通繁忙, 车流量大, 属于市区站点。采样点设置在北京大学计算中心楼顶(39.99°N, 116.31°E), 采样高度约为25 m, 东面靠近中关村大街, 南面邻近北四环路, 北面和西面有一些相对低矮的教学楼, 校园内和街道侧有少量植被, 没有重大污染源。
PAN和PPN使用PANs在线监测仪进行检测。其中2006-2007年采用美国国家海洋和大气管理局(NOAA)研发的PANs在线监测仪进行监测, 2008-2014年采用北京大学自主研发的PANs在线监测仪进行监测。其中色谱柱均为美国Restek公司生产的毛细管熔融石英色谱柱, 长5 m, 内径0.53 mm, 内涂1 μm交联三氟丙基硅氧烷(RTX-200), 色谱柱温度保持在15℃左右, 利用电子捕获检测器(ECD)进行测定, ECD温度控制在40℃, 载气为高纯氦气, 尾吹气为高纯氮气。仪器检测限为5~10 pL/L, 2007年检测时间分辨率为10分钟, 其余年份均为5分钟。PAN标准气体是通过先将一氧化氮标气与丙酮标气的混合气在紫外光(波长为285 nm)的照射下光解, 随后与不含PAN的零气混合而生成, 一氧化氮以及丙酮标准气体来自美国Scott-Marrin公司。PPN标准气体通过实验室合成制备PPN的液体溶液, 标定时采用挥发源生成。有关仪器原理、标定过程详细内容可参见文献[13-14]。
联合观测期间相关的空气污染物监测数据及气象数据均来自环境模拟与污染控制国家重点联合实验室(北京大学分室), 其中O3, NOx, SO2和CO分别采用Thermo Scientific公司Model 49i臭氧分析仪、Model 42i-TL氮氧化物分析仪、Model 43i-TLE二氧化硫分析仪、Model 48C一氧化碳分析仪进行监测[28]。
2 监测结果与分析 2.1 年际浓度变化趋势2006至2014年8月份北大站点PAN和PPN峰值浓度分别在6~17与0.6~2.2 nL/L范围, PAN浓度高于国内其他地方报道的峰值水平, 如2006年6-7月甘肃兰州的9.1 nL/L[22], 2010年4-8月上海浦东的5.5 nL/L[23], 2012年8月广东鹤山的4.7 nL/L[25], 2013年4-5月福建厦门的3.9 nL/L[26]等。国外文献报道过PANs的最高峰值浓度, 美国加州地区PAN和PPN峰值浓度分别从1960年的60~70与5~6 nL/L降低至1997年的5~10与1 nL/L[29]。
从毒理学来看, PAN的急性毒性小于O3, 与NO2接近, 比SO2高[6]。小鼠和大鼠的半致死浓度(LC50)分别为145~150 μL/L (暴露2小时)和95 μL/L (暴露4小时)。对人体而言, PAN引起人眼刺激的最低浓度水平为130 nL/L (暴露2小时)[6]。呼吸系统组织病理学改变的无观察效应水平(NOEL)和无明显损害作用水平(NOAEL)分别为200和1000 nL/L。目前监测到的PAN峰值浓度皆低于这些浓度水平。
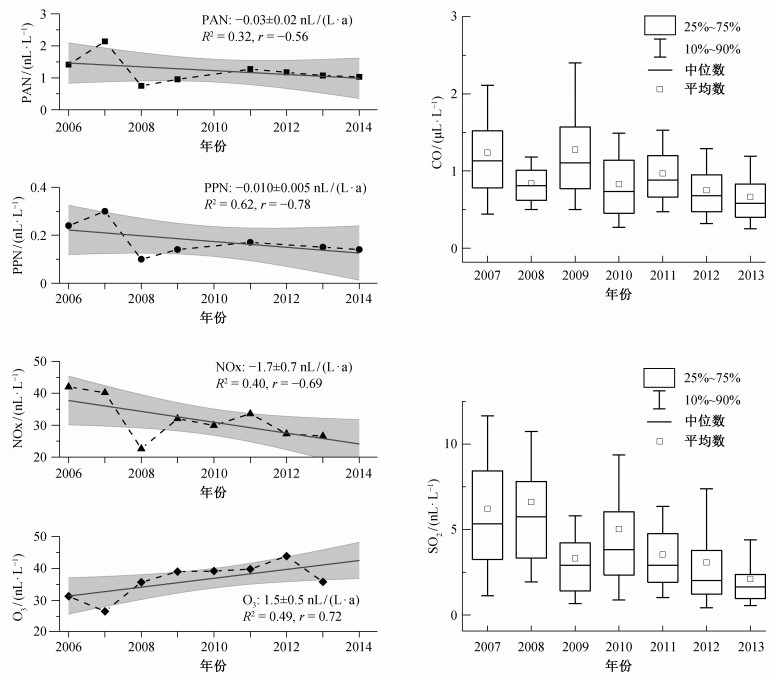
基于2006至2014年夏季8月北大站点对PAN, PPN, NOx和O3的观测, 计算各污染物月均浓度(图 1左列), 并通过线性回归反映其浓度变化趋势。结果表明, 观测期间NOx浓度以1.7±0.7 nL/(L·a)(R2=0.40;r=-0.69;约4%/a)的速率下降, PAN浓度以0.03±0.02 nL/(L·a) (R2=0.32; r=-0.56;约3%/a)的速率下降, PPN浓度以0.010±0.005 nL/(L·a)(R2=0.62;r=-0.78;约6%/a)的速率下降, O3浓度却以1.5±0.5 nL/(L·a) (R2=0.49; r=0.72;约4%/a)的速率上升。此前的研究中, 2001-2006年夏季NOx浓度以每年3.9±0.5 nL/L的速率降低, O3浓度以每年1.1±0.5 nL/L的速率上升[30]。PAN和PPN平均浓度受NOx及VOCs总量下降的影响[31], 其浓度在下降, 但是PAN/NOx比值却表现为轻微上升, 且O3浓度表现为上升, 说明大气的氧化性并没有明显下降。与此同时, 如图 1右列所示, NOx, CO和SO2等一次污染物浓度的下降, 说明近些年来采取的大气污染物控制措施对治理这些一次污染物是行之有效的。

|
| 左列为月均值, 误差带为95%置信区间, 右列为小时均值的箱线图 图 1. 2006-2014年8月北大站点PAN, PPN, NOx, O3, CO和SO2浓度的变化趋势 Figure 1. Variations in daily averages of PAN, PPN, NOx and O3 in Beijing, August from 2006 to 2014 (left) and variations in hourly averages of CO and SO2 (right) |
2007年PANs浓度出现观测期间的最高值, 主要是受到VOCs浓度变化的影响。2007年夏季北大站点测得的VOCs含量较2006年有较大升高, 特别是芳香烃类增长约50%[28], 而活性芳香烃为PAN的主要前体VOCs[32], 在NOx含量未明显降低且气象条件无明显变化的情况下, PAN浓度较2006年增长约50%。2008年PAN浓度的大幅下降可归因于中国政府为在2008年奥运会期间提高空气质量所采取的一系列联防联控措施。
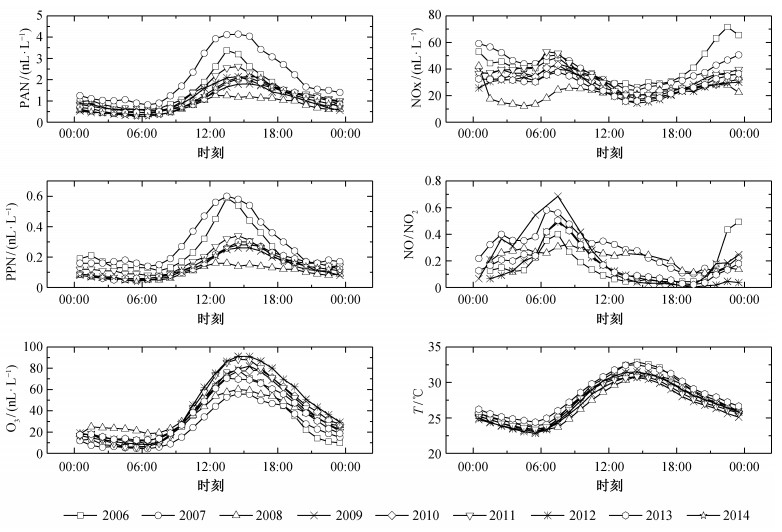
2.2 PAN与O3浓度的日变化特征PAN与O3同为典型的大气光化学反应产物, 两者的浓度与光照条件密切相关, 具有典型的日变化特征。如图 2所示, 夜晚由于缺乏光化学反应, PAN几乎没有生成, 主要通过热分解降解转化为NOx, 大气氧化性降低, NO/NO2比值逐渐升高, PAN, PPN和O3浓度都较低, 在06:00-07:00达到最低值。NOx在夜间逐渐积累, 浓度逐渐升高, 表现为双峰特征, 峰值出现在23:00和07:00左右。07:00后, 随着光照加强, NO被氧化转化为NO2, NO/NO2比值逐渐降低, 与此同时光化学反应逐渐加强, PAN, PPN和O3的生成速率大于其消耗速率, PAN, PPN和O3浓度逐渐升高。午后, 大气氧化性进一步加强, PAN和PPN峰值出现在14:00左右, O3峰值略晚于PAN, 出现在15:00左右, 此时对应NOx浓度和NO/NO2比值的低值。

|
| 图 2. PAN, PPN, O3, NOx, NO/NO2和气温的日变化 Figure 2. Diurnal cycles of PAN, PPN, O3, NOx, NO/NO2 and ambient air temperature in Beijing, August from 2006 to 2014 |
2.3 PAN与PPN浓度关系
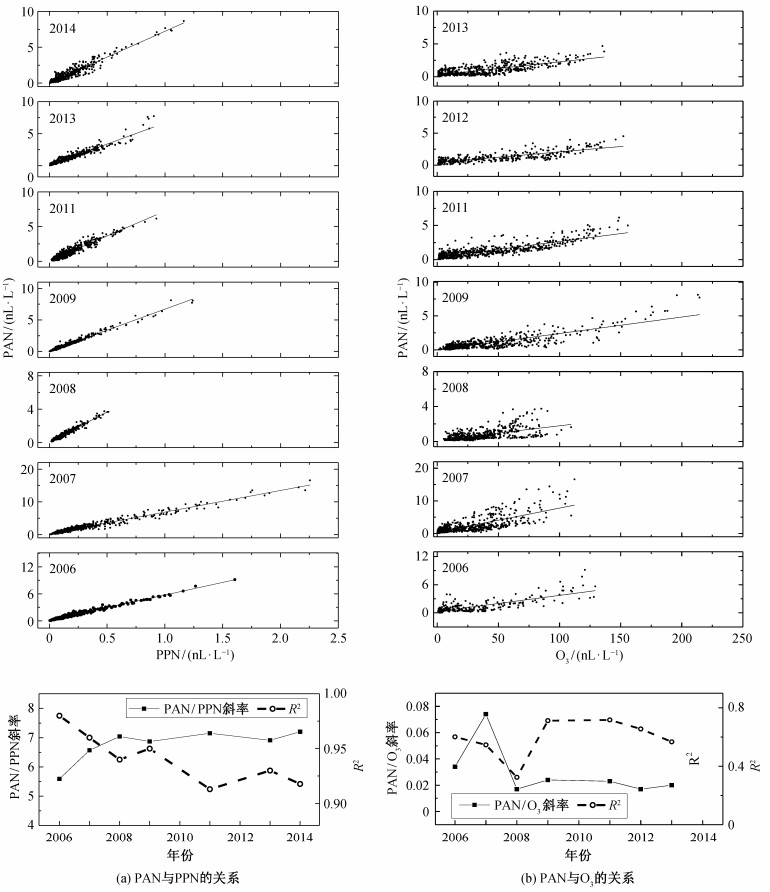
由于PAN和PPN同为光化学反应的产物, 2006-2014年的观测结果(图 3(a))显示PAN与PPN有着较好的相关性(R2均大于0.9), 各年度PAN与PPN浓度回归曲线的斜率在5.6~7.2之间。PAN和PPN有着不完全相同的前体VOC来源。PAN的前体VOC物种既有天然源又有人为源, 而PPN的前体VOC物种基本上来自人为源。因而, 根据大气中PPN与PAN的浓度的比例关系, 便可大致推断出当地大气中VOCs的主要来源。PAN与PPN浓度回归曲线的斜率越低, PPN的比重越大, 说明人为源VOCs参与光化学反应的比例越高[33], Roberts等[34]提出当PPN/PAN斜率在5.8~7.4之间时, 表明该地区光化学过程主要受人为源VOCs影响。从图 3(a)中各曲线斜率可以看出, 北大站点所处中关村地区的光化学污染主要受人为源VOCs影响。这9年内回归曲线的斜率值逐渐升高, 说明人为源VOCs在PANs物质生成中所占比例逐渐减小, 与VOCs的监测结果一致[31]。

|
| 图 3. PAN与PPN和O3之间的关系 Figure 3. Correlations between PAN, PPN and O3 |
2.4 PAN与O3浓度关系
同为NOx与VOCs光化学反应产物的PAN与O3之间存在着一定的相关性。2006-2013年间PAN与O3浓度间的回归曲线斜率在0.02~0.08的范围(图 3(b))。该比值与文献报道的其他地方的比值相近, 如墨西哥城平均0.03[35]。绝大部分VOCs都能作为O3的前体物, 而PAN的前体VOCs为能够产生CH3CO自由基的那部分VOCs, 因此根据两者比值的变化可以大致判断影响PAN和O3的主要VOCs组分的变化。PAN/O3斜率呈下降趋势, 说明主导PAN生成的VOCs占总反应VOCs的比例有所下降。
3 结论2006-2014年北京夏季NOx浓度以每年1.7 nL/L (约4%/a)速率下降, PAN浓度以每年0.03 nL/L (约3%/a)的速率下降, O3浓度却以每年1.5 nL/L (约4%/a)的速率上升, 表明这些年采取的治理NOx的措施对控制PAN浓度有效。治理O3方面, 需要在控制NOx的同时加强对VOCs排放的控制。
监测期间PAN与PPN浓度回归曲线的斜率介于5.6~7.2之间, 呈上升趋势, 表明北京城区光化学污染主要受人为源VOCs影响, 且人为源VOCs占总反应VOCs的比例在下降。PAN与O3浓度回归曲线的斜率介于0.02~0.08之间, 呈下降趋势, 表明主导PAN生成的VOCs占总反应VOCs的比例有所下降。
| [1] | Fischer E V, Jacob D J, Yantosca R M, et al. Atmospheric peroxyacetyl nitrate (PAN): a global budget and source attribution. Atmospheric Chemis-try and Physics , 2014, 14 (5) : 2679–2698 DOI:10.5194/acp-14-2679-2014 . |
| [2] | 唐孝炎, 张远航, 邵敏. 大气环境化学. 2版. 北京: 高等教育出版社, 2006 . |
| [3] | Kleindienst T E. Recent developments in the chemistry and biology of peroxyacetyl nitrate. Research on Chemical Intermediates , 1994, 20 : 335–384 DOI:10.1163/156856794X00379 . |
| [4] | Seinfeld J H, Pandis S N. Atmospheric chemistry and physics: from air pollution to climate change. New York: John Wiley & Sons, 2012 |
| [5] | Dugger W M, Klein W H, Taylor O C, et al. Action spectrum of peroxyacetyl nitrate damage to bean plants. Nature , 1963, 198 : 75–76 DOI:10.1038/198075a0 . |
| [6] | Vyskocil A, Viau C, Lamy S. Peroxyacetyl nitrate: review of toxicity. Human & Experimental Toxico-logy , 1998, 17 (4) : 212–220 . |
| [7] | Singh H B, Salas L J, Ridley B A, et al. Relationship between peroxyacetyl nitrate and nitrogen-oxides in the clean troposphere. Nature , 1985, 318 : 347–349 DOI:10.1038/318347a0 . |
| [8] | Nielsen T, Samuelsson U, Grennfelt P, et al. Peroxyacetyl nitrate in long-range transported pol-luted air. Nature , 1981, 293 : 553–555 DOI:10.1038/293553a0 . |
| [9] | Stephens E R, Hanst P L, Doerr R C, et al. Reactions of nitrogen dioxide and organic compounds in air. Industrial & Engineering Chemistry , 1956, 48 (9) : 1498–1504 . |
| [10] | Singh H B, Salas L J, Viezee W. Global distribution of peroxyacetyl nitrate. Nature , 1986, 321 : 588–591 DOI:10.1038/321588a0 . |
| [11] | Payne V, Alvarado M, Cady-Pereira K, et al. Global satellite retrievals of Peroxy Acetyl Nitrate (PAN) in the troposphere // Proceedings of the AGU Fall Meeting. San Francisco, 2013: 0182 |
| [12] | 张剑波, 唐孝炎. 大气中PAN的测定及其与前体物的关系. 环境化学 , 1994, 13 (1) : 30–39. |
| [13] | 王斌, 张剑波. 夏季北京市大气中PAN与PPN的监测分析. 环境科学 , 2007, 28 (7) : 1621–1626. |
| [14] | 杨光, 张剑波, 王斌. 2006年夏季北京大气中PAN与PPN浓度变化和相关性分析. 北京大学学报:自然科学版 , 2009, 45 (1) : 144–150. |
| [15] | Zhang J B, Xu Z, Yang G, et al. Peroxyacetyl nitrate (PAN) and peroxypropionyl nitrate (PPN) in urban and suburban atmospheres of Beijing, China. Atmospheric Chemistry and Physics Discussions , 2011, 11 (3) : 8173–8206 DOI:10.5194/acpd-11-8173-2011 . |
| [16] | Xu Z, Zhang J, Yang G, et al. Acyl peroxy nitrate measurements during the photochemical smog season in Beijing, China. Atmospheric Chemistry and Physics Discussions , 2011, 11 (3) : 10265–10303 DOI:10.5194/acpd-11-10265-2011 . |
| [17] | Gao T, Han L, Wang B, et al. Peroxyacetyl nitrate observed in Beijing in August from 2005 to 2009. Journal of Environmental Sciences (China) , 2014, 26 (10) : 2007–2017 DOI:10.1016/j.jes.2014.08.002 . |
| [18] | Xue L K, Wang T, Wang X F, et al. On the use of an explicit chemical mechanism to dissect peroxy acetyl nitrate formation. Environmental Pollution , 2014, 195 : 39–47 DOI:10.1016/j.envpol.2014.08.005 . |
| [19] | Zhang H L, Xu X B, Lin W L, et al. Wintertime peroxyacetyl nitrate (PAN) in the megacity Beijing: Role of photochemical and meteorological processes. Journal of Environmental Sciences (China) , 2014, 26 (1) : 83–96 DOI:10.1016/S1001-0742(13)60384-8 . |
| [20] | Zhang G, Mu Y J, Liu J F, et al. Seasonal and diurnal variations of atmospheric peroxyacetyl nitrate, peroxypropionyl nitrate, and carbon tetrachloride in Beijing. Journal of Environmental Sciences (China) , 2014, 26 (1) : 65–74 DOI:10.1016/S1001-0742(13)60382-4 . |
| [21] | Zhang G, Mu Y, Zhou L, et al. Summertime distributions of peroxyacetyl nitrate (PAN) and peroxypropionyl nitrate (PPN) in Beijing: under-standing the sources and major sink of PAN. Atmospheric Environment , 2014, 103 : 289–296 . |
| [22] | Zhang J M, Wang T, Ding A J, et al. Continuous measurement of peroxyacetyl nitrate (PAN) in suburban and remote areas of western China. Atmospheric Environment , 2009, 43 (2) : 228–237 DOI:10.1016/j.atmosenv.2008.09.070 . |
| [23] | 韩丽, 张剑波, 王凤. 2010年世博会期间上海大气中PAN和PPN的监测分析. 北京大学学报:自然科学版 , 2013, 49 (3) : 497–503. |
| [24] | Wang B, Shao M, Roberts J M, et al. Ground-based on-line measurements of peroxyacetyl nitrate (PAN) and peroxypropionyl nitrate (PPN) in the Pearl River Delta, China. International Journal of Environmental Analytical Chemistry , 2010, 90 (7) : 548–559 DOI:10.1080/03067310903194972 . |
| [25] | 周炎, 岳玎利, 钟流举, 等. 广东鹤山地区夏季大气中PAN污染特征. 环境监测管理与技术 , 2013, 25 (4) : 24–27. |
| [26] | 王坚, 赵丽娟, 黄厔. 厦门市光化学污染研究. 中国人口·资源与环境 , 2014, 2 (S2) : 131–135. |
| [27] | Wang S, Xing J, Zhao B, et al. Effectiveness of national air pollution control policies on the air quality in metropolitan areas of China. Journal of Environmental Sciences , 2014, 26 (1) : 13–22 DOI:10.1016/S1001-0742(13)60381-2 . |
| [28] | Zhang Q, Yuan B, Shao M, et al. Variations of ground-level O3 and its precursors in Beijing in summertime between 2005 and 2011. Atmospheric Chemistry and Physics , 2014, 14 (12) : 6089–6101 DOI:10.5194/acp-14-6089-2014 . |
| [29] | Grosjean D. Ambient PAN and PPN in southern California from 1960 to the SCOS97-NARSTO. Atmospheric Environment , 2003, 37 : 221–238 DOI:10.1016/S1352-2310(03)00392-3 . |
| [30] | Tang G, Li X, Wang Y, et al. Surface ozone trend details and interpretations in Beijing, 2001-2006. Atmospheric Chemistry and Physics , 2009, 9 (22) : 8813–8823 DOI:10.5194/acp-9-8813-2009 . |
| [31] | Wang M, Shao M, Chen W, et al. Trends of non-methane hydrocarbons (NMHC) emissions in Beijing during 2002-2013. Atmospheric Chemistry and Physics , 2015, 15 (3) : 1489–1502 DOI:10.5194/acp-15-1489-2015 . |
| [32] | Liu Z, Wang Y, Gu D, et al. Evidence of reactive aromatics as a major source of peroxy acetyl nitrate over China. Environmental Science & Technology , 2010, 44 (18) : 7017–7022 . |
| [33] | Williams J, Roberts J M, Fehsenfeld F C, et al. Regional ozone from biogenic hydrocarbons deduced from airborne measurements of PAN, PPN, and MPAN. Geophysical Research Letters , 1997, 24 (9) : 1099–1102 DOI:10.1029/97GL00548 . |
| [34] | Roberts J M, Williams J, Baumann K, et al. Measurements of PAN, PPN, and MPAN made during the 1994 and 1995 Nashville Intensives of the Southern Oxidant Study: implications for regional ozone production from biogenic hydrocarbons. Journal of Geophysical Research-Atmospheres , 1998, 103 (D17) : 22473–22490 DOI:10.1029/98JD01637 . |
| [35] | Marley N A, Gaffney J S, Ramos-Villegas R, et al. Comparison of measurements of peroxyacyl nitrates and primary carbonaceous aerosol concentrations in Mexico City determined in 1997 and 2003. Atmospheric Chemistry and Physics , 2007, 7 (9) : 2277–2285 DOI:10.5194/acp-7-2277-2007 . |
 2016, Vol. 52


