文章信息
- 廖媛, 吕肖庆, 孙建伶, 汤帜, 王勇涛
- LIAO Yuan, Lü Xiaoqing, SUN Jianling, TANG Zhi, WANG Yongtao
- 一种基于星型图的汉字镜像对称检测方法
- A Star-Graph-Based Detection Method for Reflection Symmetry of Chinese Characters
- 北京大学学报(自然科学版), 2016, 52(1): 41-48
- Acta Scientiarum Naturalium Universitatis Pekinensis, 2016, 52(1): 41-48
-
文章历史
- 收稿日期: 2015-06-05
- 修回日期: 2015-08-17
- 网络出版日期: 2015-09-29
2. 数字出版技术国家重点实验室, 北京 100871;
3. 中国文字字体设计与研究中心, 北京 100871;
4. 浙江大学计算机科学与技术学院, 杭州 310027
2. State Key Laboratory of Digital Publishing Technology, Beijing 100871;
3. Center for Chinese Font Design and Research, Beijing 100871;
4. College of Computer Science and Technology, Zhejiang University, Hangzhou 310027
The natural world in which we live is characterized by miraculous phenomena involving symmetry. Symmetry is also a significant structural feature that profoundly influences the development of Chinese characters. As the foundation of an ideographic script, many Chinese characters were originally created to simulate and describe nature, including the symmetries in various objects and phenomena. Given the external morphology of symmetry, most characters not only reflect the visual effects of harmony, such as balance, stability, and massiveness, but the symmetry also enables our ancestors to distinguish and remember these characters with remarkable convenience. Many Chinese characters exhibit global and local symmetry, as shown in Fig. 1.

|
| Figure 1. Examples of symmetric Chinese characters |
Throughout the long-term evolutionary process of Chinese characters, the symmetries of almost all characters have not remained static. Rather, these characters underwent complex progressive develop-ment involving inheritances and mutations. For example, we can perceive the original demand of the character “草” (grass) for symmetry through its early shapes, such as the oracle bone inscription and the warring states script depicted in Fig. 2(a) and (b).

|
| Figure 2. Glyph variations in the Chinese character for “grass” over different historic periods |
Fig. 2(c) indicates that the small seal script of the character “草” is almost perfectly symmetrical, with a free-flowing, gracefully curved shape. The clerical script (Fig. 2(d)) inherits the symmetry from the small seal script, however, the curved strokes are replaced with straight strokes. As the standard font type of writing, the regular script (Fig. 2(e)) is in fact a hybrid of the semi-cursive and the neo-clerical scripts. To facilitate smooth writing and to achieve a beautiful and abstract appearance, the semi-cursive (Fig. 2(f)) and cursive scripts (Fig. 2(g)) eliminate angular strokes and simplify characters through highly rounded and soft shapes. This observation suggests that the effect of symmetry on regular, semi-cursive, and cursive scripts does not disappear. The symmetric structures in these scripts are progressively lenient; nonetheless, a new level of visual balance is achieved based on implicit and dynamic symmetries with width variation, stroke tip decorations, and the continuity of trajectories.
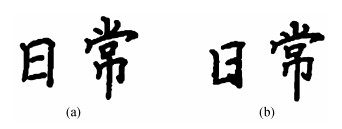
The significance of symmetry research lies in the following aspects: exploring more characteristics and regularities in typeface design and font development, providing ordinary students and professional calli-graphers with helpful advices (for instance, the guide to good handwriting, as illustrated in Fig. 3), and promoting the recognition and retrieval of Chinese characters further by simplifying feature descriptions and matching algorithms.
|
| Figure 3. Positive examples (a) and counter examples (b) of symmetry in handwritten Chinese characters |
Accurate symmetry detection is crucial to further analysis in many cases. However, researchers encounter several challenges at present: first, the explanation for most symmetrical phenomena depends heavily on visual perception. To our knowledge, no accepted computational model that accurately simulates the perception of symmetry has been developed in general. In fact, numerous features that contribute to symmetrical perception captivate us when selecting the dominant features to represent symmetry. Second, despite our focus on some of these preferred features, describing these characteristics quantitatively is another serious problem. Last, these features are correlatively dependent and interplay with one another. To a certain extent, some combinations play a more important role in the formation of characters than the individual features themselves do.
2 Related WorkTo detect symmetry effectively, a variety of methods have been proposed recently. Most of them can be classified into two categories: SIFT-based and contour-based.
SIFT is adopted in many symmetry detection algorithms due to its scale invariant property. Park et al.[1] evaluated the performance of three state-of-the-art symmetry detection algorithms. The LE algorithm proposed by Loy et al.[2] is a classic method on the basis of matching symmetric pairs of feature points. It adopted SIFT to describe the feature points and voted potential pairs of symmetry point in Hough space to find the dominent symmetry axes. Cho et al.[3] improved the LE algorithm using symmetry-growing. Sun et al.[4] established a symmetry axis matrix that described the relationship betwween an original region and its symmetrically reflected region. Hauagge et al.[5] presented a technique to extract local features for image matching on the basis of detecting local symmetries. Xiang et al.[6] proposed a centripetal-SIFT edge descriptor to detect the location of symmetric object. Lee et al.[7] adopted a gradient filter and a Canny edge detector to increase the quantity of SIFT feature points.
Many symmetry detection models are mainly based on contour information[8-10]. Ming et al.[11] constructed a directed graph of symmetry interaction. Each symmetric element, which is a trapezoid consisting of a pair of line segments and a corresponding symmetric axis, is represented as a node in a graph. An edge between two nodes is added when the two symmetric axes are close enough. The symmetric objects are detected with a search method of subgraphs.
In addition to the detection of symmetry axis, the assessment of symmetry magnitude also attracts many researchers. Lee et al.[12] defined the symmetry intensity as gref=exp (-|d|), where dis the Euclidean distance between each point and corresponding symmetry axis. Dalitz et al.[13] introduced an intensity for rotational symmetry and obtained the sizes of symmetry region. Fu et al.[14] defined a symmetry magnitude map by estimating the symmetry intensity of each point in an image.
To summarize, the SIFT-based algorithms are more robust than other methods, but they also have obvious drawbacks, for example, relying too much on the effect of SIFT detection. The Contour-based algorithms sometimes outperform the SIFT-based methods. However the low accurancy of countor detection also limits the efficience of such algori-thms. Combining different types of feature leads to the more accurate detetion of symmetry.
3 Symmetry Detection via Mutual Enhancement of Double Types of Feature 3.1 WorkflowSymmetry perception is a complex procedure that combines different features. Recent studies in the field of cognitive psychology suggest that humans observe symmetric objects by processing features in different layers, such as edges and points. Point features represent the local information on color and texture, whereas edge features represent shape information. These features complement each other mutually. Thus, a new model can be established based on the combination of SIFT-based features with contour-based features.
In this model, a potential symmetry element (PSE) is defined as a pair of point features or a pair of edge features that correspond to a potential symmetry axis (PSA) on the basis of regular symmetry transformation. To describe the relationship among PSAs, a directed star graph with symmetry weight (S-graph) is introduced. The nodes of this graph are PSAs, and its edges represent the mutual influences among these axes. As part of the S-graph, the single-PSA-centered subgraph can be adopted to calculate local symmetry intensity.
The main workflow consists of following steps. First, we derive all of the SIFT points and edges from a preprocessed image. Second, we select PSEs and their corresponding PSAs. Then, a S-graph is constructed to describe the symmetry information on the image. Each salient symmetric object can be represented as a star subgraph. Next, the local symmetry detection problem is transformed into a problem with determining the subgraph that exhibits the local maximum magnitude. Last, the magnitudes of all the star subgraphs are projected to Hough space, and the most significant symmetric axes are detected as the maximum points.
3.2 PSE and PSATwo kinds of PSE are adopted in our approach: contour-based and SIFT-based PSEs.
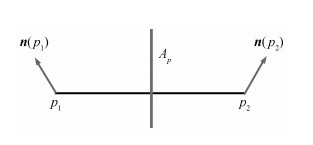
3.2.1 SIFT-based PSEA SIFT-based PSE is converted from a pair of similar feature vectors in LE[2]. In our model, we define a PSA generated by a SIFT-based PSE, such as Ap in Fig. 4, as the mid-perpendicular of line (
|
| Figure 4. SIFT-based PSE and PSA |
In Fig. 4, n(p1) and n(p2) are feature vectors. The weight of Ap is defined as
| $ {w_{{A_p}}} = \cos < \boldsymbol{n}({p_1}), \;\boldsymbol{n}({p_2}) > $ | (1) |
Eq. (1) assigns a high weight to PSAs that are formed by similar SIFT feature point pairs.
3.2.2 Contour-based PSEContour symmetry is a significant feature for symmetric objects. Contours are generaly irregular curves, therefore, the line-fitting algorithm is adopted to segment and to represent contours. Two line segments with enough probability of a boundary (Pb value)[15] are selected to form a PSE. The angular bisector of each line pair is regarded as a PSA. Fig. 5 illustrates an example of a contour-based PSE and its corresponding PSA.
In Fig. 5, l1 and l2 are two lines that are regarded as PSEs. An angular bisector is positioned between these lines, and they project themselves to this bisector. If the overlap area of the projections is not empty, then a PSA Al is generated. S1 and S2 represent the corresponding parts of l1 and l2 that contribute to Al. The weight of Al is defined as
| ${w_{{A_l}}} = \frac{{{D_{{A_l}}}}}{{\max ({D_{{A_l}}})}}.$ | (2) |

|
| Figure 5. Contour-based symmetry element |
DAl is the length of Al, and (DAl) is the maximum length of all PSAs generated by all PSEs. Eq. (2) assigns high weights to PSAs formed by long contours.
3.3 Directed graph of enhancement relationTo combine contour-based and SIFT-based PSEs, we construct a directed graph of enhancement relation, i.e., the S-graph, to describe the symmetry information of an image. Each PSA is abstracted as a node in the S-graph, and the directed edge eij linking nodes i and j reflects how strong the node i can enhance the symmetry intensity represented by node j.
If two PSAs generated by two PSEs are close enough, then the reliability of symmetry will be mutually enhanced. Specifically, small angle and short distance between two PSAs will lead to their enhanced intensity of symmetry for each other. The magnitude of the enhancement for each edge is calculated using the following formula:
| $ {e_{ij}} = {w_i} \cdot {g_{ij}} $ | (3) |
Where wi is the weight of node i, and gij is the position relationship between the two nodes. Eq. (3) indicates that the enhancement magnitude is proportional to the saliency of node i. gij is defined as
| ${g_{ij}} = \cos (\Delta \theta ) \cdot {\text{exp}}\left( { - \frac{{{d_{ij}}}}{\sigma }} \right), $ | (4) |
Where Δθis the angle between two PSAs, and dij is the distance between the centers of the two PSAs. Eq. (4) assigns a large value to a pair of PSAs with close relationships.
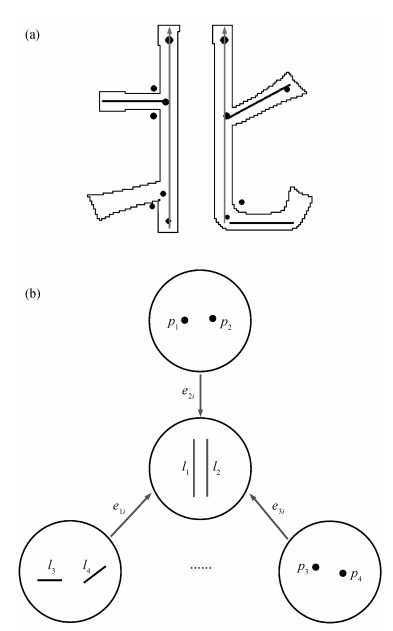
As the PSA nodes are added from both SIFT-based and contour-based PSEs, the enhancement between different types of features can be obtained in this model. Fig. 6 is an example of a directed graph of enhancement relation. Our approach is different from existing methods that mainly depend on a single type of feature because it adopts more image context to achieve more accurate symmetry intensity.
|
| (a) Chinese character “北” and the detected SIFT points and line segments; (b) A star subgraph with a central node representing the current PSE with arrows and several relative nodes Figure 6. An example of the S-graph |
3.4 Extract star subgrap as symmetry object
A symmetric object consists of a set of symmetric elements. Correspondingly, PSEs that contribute the same symmetry axis strongly enhance one another. Therefore, we translate the identification of a symmetry object to find a subgraph with strong enhancement relations.
We undertake several topologies of subgraphs, including star, chain, and tree[11, 16-17]. Our experiments verify that the star subgraph outperforms the other types of subgraphs. The star subgraph ensures that all the leave nodes close to the center node contribute the same symmetry axes. However, the nodes in a chain or tree may share different axes. The larger the number of nodes becomes, the more calculations have to be performed for the irrelevant axes.
The symmetry magnitude of star subgraph Si is defined as the sum weight of the center node i and all incoming directed edges with the following formula:
| ${S_i} = \alpha {w_i} + (1 - \alpha )\left( {\beta \sum\nolimits_{j \in {A_l}} {{e_{ji}}} + (1 - \beta )\sum\nolimits_{k \in {A_p}} {{e_{ki}}} } \right), $ | (5) |
where wi is the weight of center node i, the current SPA (an Al or an Ap). α and β are parameters whose values are between 0 and 1. α represents the importance of the current center when it becomes large. When β is high, the influence of line pairs is enhanced. We introduce threshold γ of gij to filter unimportant links and thus simplify the calculation. In short, only the edges that satisfy gij≥γ are regarded as the relative edges that possibly share the same axis.
3.5 Symmetry axis detectionA star subgraph should have a local maximum magnitude in the directed graph. To find the local maximum magnitude, a star subgraph is projected to Hough space as a point. The magnitude of a star subgraph corresponds to the weight of the Hough space point. When the local maximum points in the Hough space are detected, the corresponding symmetry axes are also detected.
4 ExperimentThe proposed method is implemented in Matlab 2012. In our experiments, the parameter values for the algorithm are set as follows: σ=20 in Eq. (4), and reliable edge threshold γ=0.75. We set the value for parameter α, β in Eq. (5) as 0.3 to ensure the optimal performance of our method in the experiment dataset. Moreover, we construct a dataset that consists of 6713 images of Chinese characters presented in the Hei typeface and evaluate our method on the dataset. The symmetric axes in the ground truth dataset are represented by the two endpoints of a line segment. A detected axis is considered to be correct if the angle between the ground truth axis and the axis in question is less than 5°, and the distances between the endpoints of a ground truth axis and the corresponding endpoints of a detected axis are less than 8% of char size.
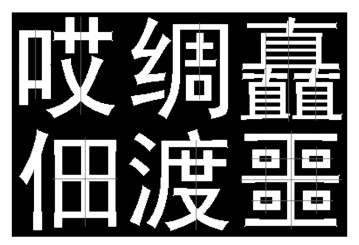
Examples of the experiments are shown in Fig. 7. The detected axes are represented by gray lines.
|
| Figure 7. Sample results obtained with the proposed method |
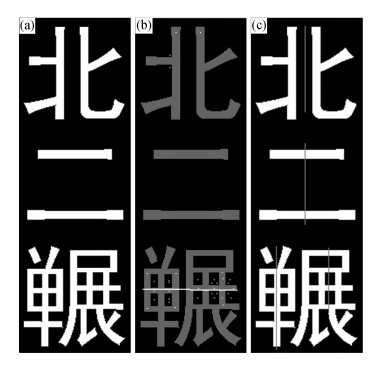
The proposed method generates better axis detection results than the LE method does, especially when the images contain less effective SIFT points. Fig. 8 depicts the comparison.
|
| (a) original images; (b) symmetry axes detected by LE method; (c) results detected by the proposed method Figure 8. Detection results of the LE method and the proposed method on images with fewer SIFT points |
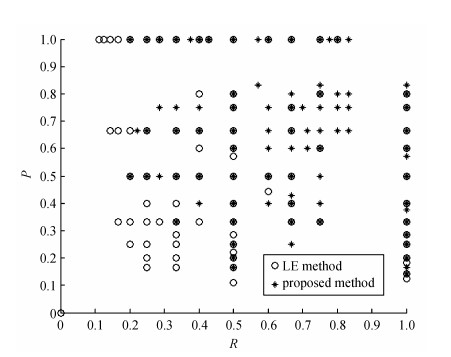
We compare the precision and recall rates of our results with those of LE method findings[2]. Table 1 shows the statistical results on the dataset. Average P and R of LE method are P=0.5777, R=0.5202; ave-rage P and R of proposed method are P=0.5952, R=0.6401. The two methods report almost similarly accurate results (P=1, R=1); however, the proposed method generates fewer erroneous results (P=0, R=0). Furthermore, the proposed method generally produces a better overall detection result with a higher averageP and R than the LE method does. Additional details on the detection results are shown in Fig. 9.
|
| Figure 9. P and R distribution of partly detected characters |
Fig. 9 indicates that P and R generated by the proposed method are mainly located in the top right region of the PR coordinate system, whereas P and R generated by LE method are primarily distributed at the bottom left region. This scenario implies that our method outperforms LE method given characters whose symmetry can be only partially detected.
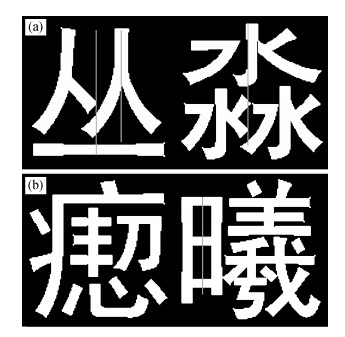
Nonetheless, the proposed method does not detect all of the symmetry axes of Chinese characters correctly. In fact, this technique fails on some complicated Chinese characters, such as when the main symmetry axis is affected by many overlapping strokes, as illustrated in Fig. 10.
|
| (a) The symmetry axes are affected by the deformation of the character components; (b) The failure of axes in detecting characters with complex structures Figure 10. Examples of the incorrect results |
To overcome the weaknesses of the current method, future works should explore more symmetry features, improve the efficiency of the graph model, and refine the selection process of candidate axes.
5 ConclusionLimited texture features make traditional sym-metry detection methods not effective for Chinese character symmetry detection. For this matter, a detection method of bilateral symmetry combining SIFT-based and contour-based features is proposed in this paper. A directed graph of enhancement relation is constructed, and each symmetric element is represented as a node in the graph. A star subgraph search method is also proposed to identify the potential symmetry objects. Our experiment on Chinese character images shows that the proposed approach outperforms the existing single-type-feature-based methods.
| [1] | Park M, Lee S, Chen P C, et al. Performance evaluation of state-of-the-art discrete symmetry detection algorithms // Computer Vision and Pattern Recognition, CVPR 2008. Anchorage, AK, 2008: 1-8 |
| [2] | Loy G, Eklundh J O. Detecting symmetry and symmetric constellations of features // Computer Vision-ECCV 2006. Berlin: Springer, 2006: 508-521 |
| [3] | Cho M, Lee K M. Bilateral symmetry detection via symmetry-growing // BMVC. London, 2009: 1-11 |
| [4] | Sun Y, Bhanu B. Reflection symmetry-integrated image segmentation. IEEE Transactions on Pattern Analysis and Machine Intelligence , 2012, 34 (9) : 1827–1841 DOI:10.1109/TPAMI.2011.259 . |
| [5] | Hauagge D C, Snavely N. Image matching using local symmetry features // IEEE Conference on Computer Vision and Pattern Recognition (CVPR). Providence, RI, 2012: 206-213 |
| [6] | Xiang Y, Li S. Symmetric object detection based on symmetry and centripetal-SIFT edge descriptor // 21st International Conference on Pattern Recognition (ICPR). Tsukuba, 2012: 1403-1406 |
| [7] | Lee S, Liu Y. Curved glide-reflection symmetry detection. IEEE Transactions on Pattern Analysis and Machine Intelligence , 2012, 34 (2) : 266–278 DOI:10.1109/TPAMI.2011.118 . |
| [8] | Prasad V, Yegnanarayana B. Finding axes of symmetry from potential fields. IEEE Transactions on Image Processing , 2004, 13 (12) : 1559–1566 DOI:10.1109/TIP.2004.837564 . |
| [9] | Stahl J S, Wang S. Globally optimal grouping for symmetric closed boundaries by combining boundary and region information. IEEE Transactions on Pattern Analysis and Machine Intelligence , 2008, 30 (3) : 395–411 DOI:10.1109/TPAMI.2007.1186 . |
| [10] | Ylä-Jääski A, Ade F. Grouping symmetrical structures for object segmentation and description. Computer Vision and Image Understanding , 1996, 63 (3) : 399–417 DOI:10.1006/cviu.1996.0031 . |
| [11] | Ming Y, Li H, He X. Symmetry detection via contour grouping // 20th IEEE International Conference on Image Processing (ICIP). Melbourne, VIC, 2013: 4259-4263 |
| [12] | Lee S, Liu Y. Symmetry-Driven Shape Matching[R]. University Park: Pennsylvania State University, 2009 |
| [13] | Dalitz C, Pohle-Fröhlich R, Bolten T. Detection of symmetry points in images // VISAPP. Barcelona, 2013: 577-585 |
| [14] | Fu H, Cao X, Tu Z, et al. Symmetry Constraint for Foreground Extraction. IEEE Transactions on Cyber-netics , 2014, 44 (5) : 644–654 DOI:10.1109/TCYB.2013.2264051 . |
| [15] | Arbelaez P, Maire M, Fowlkes C, et al. Contour detection and hierarchical image segmentation. IEEE Transactions on Pattern Analysis and Machine Intelligence , 2011, 33 (5) : 898–916 DOI:10.1109/TPAMI.2010.161 . |
| [16] | Ishikawa H, Geiger D, Cole R. Finding tree structures by grouping symmetries // Tenth IEEE International Conference on Computer Vision. Beijing, 2005: 1132-1139 |
| [17] | Liu Y, Hel-Or H, Kaplan C S. Computational symmetry in computer vision and computer graphics. Hanover, MA: Now publishers Inc, 2010 . |
 2016, Vol. 52


