(a)和(b)中两条竖直红线之间的赤道印度洋地区为本文研究的主要区域, 下同
图1 1986年5—10月赤道印度洋OLR异常的EOF1和EOF2模态的空间分布和时间序列
Fig. 1 Spatial loadings of OLR anomalies regressed onto the EOF1 and EOF2 modes and time series over equatorial Indian Ocean from May to October in 1986
doi: 10.13209/j.0479–8023.2023.044
国家自然科学基金(41725021, 91737204)资助
收稿日期: 2022‒06‒11;
修回日期: 2023‒06‒23
北京大学学报(自然科学版) 第59卷 第4期 2023年7月
Acta Scientiarum Naturalium Universitatis Pekinensis, Vol. 59, No. 4 (July 2023)
摘要 利用高分辨率的卫星资料和再分析资料, 详细地探究 1985—2017 年夏季(5—10 月)热带印度洋季节内振荡(TISO)的北向传播过程和特征。结果表明, 印度洋 TISO 的北向传播可以分为 3 类: 稳定型, 对流信号起源于赤道以南, 印度洋西部, 稳定地向北传播至印度半岛北部; 衰减型, 前期与稳定型相似, 但向北传播至孟加拉湾附近后迅速衰减; 增强型, 前期在赤道附近信号较弱, 大约 10 天后, 对流信号从印度半岛南部开始显著增强, 并发展至喜马拉雅山脉以南。TISO 北向传播过程中伴随显著的东风切变异常、海表面温度异常和边界层水汽扰动, 三者在不同类型的北向传播中起不同的作用。对流事件北侧的海温正异常会促进对流的北向传播, 在稳定型和衰减型的赤道传播过程中都起到显著的作用, 增强型传播过程中海温正异常在对流南侧更显著, 会抑制对流的北向传播。东风垂直切变机制为稳定型和增强型的稳定北向传播提供持续的动力, 在事件后期的影响更加显著。边界层水汽扰动的经向不对称性在稳定型事件前后、衰减型事件前期以及增强型事件发生时加剧大气的不稳定性, 诱导对流系统向北移动。研究结果有助于提高东南亚夏季季节内降水预测的准确性。
关键词 夏季; 热带季节内振荡(TISO); 北向传播; 印度洋; 降水预测
夏季的热带季节内振荡(tropical intraseasonal os-cillation, TISO)是热带大气重要的次季节变化信号, 具有 10~90 天的准周期性特征。在 Madden 等[1–2]发现沿赤道东传的马登–朱利安振荡(Madden Julian oscillation, MJO)之前, 谢义炳等[3]已在亚洲季风区发现非常显著的季节内振荡, 之后被 Yasunari[4]和Murakami[5]相继证实。
夏季 TISO 的传播模式主要有向东传播和向北传播两大类。与冬季 MJO 相比, TISO 对流表现出更加复杂的时空演变, 不仅存在区域性[6]和季节性[7]特征, 而且其结构和传播特征有显著的差异。TISO对许多天气和气候现象都有强烈的影响, 如亚洲夏季风的爆发和中断[8–10]、热带气旋[11–13]和极端天气事件[14–15]。其中, 从赤道印度洋向北传播的 TISO跨过海洋性大陆向东北方向传播, 进入南中国海和西北太平洋[16], 再沿着中国东部一直向北到太行山一带的季节内振荡, 对南海、华南、华东和华北地区的天气都有影响[17–18]。
为了更好地理解和描述 TISO 北向传播事件, 在实时多变量 MJO(real-time multivariate MJO)指数[19]的基础上, 多种针对北向传播的指数被相继提出[20–22]。Lee 等[23]基于向外长波辐射(outgoing long-wave radiation, OLR)提出的 BSISO(boreal summer intraseasonal oscillation, 北半球夏季季节内振荡)指数应用最为广泛, 其中包含两种形式的组合物理模态, 即 BSISIO1 和 BSISO2 指数, 用于监控和表征BSISO 的强度信号、传播和频率等。Wang 等[24]结合前人的研究, 提出较高双变量相关性的 OLR-based MJO 指数, 能够更大程度地代表夏季对流向东和向北的传播。随着研究的深入, 有研究者根据TISO 的地域性差异对时空模态进行分类[25–26], 也有研究者根据传播方向进行具体的分析[27–28]。
过去的几十年中, 有大量研究解释 TISO[25,29–33]。有关夏季 TISO 的理论工作大都致力于解释向北传播的特征和机制, 早期有理论假设地表热通量进入大气边界层可能会影响对流北侧的大气不稳定度, 导致对流向北移动[34]。此后的工作表明, Kelvin-Rossby 波包(即 MJO 型的波动)从赤道地区移动到中部赤道太平洋时, 平均海面温度(sea surface tempe-rature, SST)和比湿度的降低可以使 Rossby 波向赤道外发散, 从而在边界层辐合等作用下引起明显的北向传播, 这被认为是夏季 TISO 北向传播的重要来源之一[13,35–36]。还有研究者提出波浪动力学和涡旋–风切变相互作用等动力学理论来解释 TISO 的北向传播[37–38]。使用气候模型[39]发现, 边界层水分对流和正压涡旋效应共同导致 TISO 的北向传播。由于 TISO 的对流主体和环流主要在热带印度洋和西太平洋暖池区域活动, 因此海–气相互作用对振荡的影响很早就引起关注[2]。大型国际观测计划(如TOGA COARE[40], JASMINE[41]和 DYNAMO[42])的研究结果和卫星资料相继证实, 对流的前(后)存在正(负)海表温度扰动[43]。模式结果也证实, 耦合的海–气模式比单独的大气模式能够更好地描述 TISO的发展和传播[44]。
由于全球气候变化的加剧和夏季风在各种时间和空间尺度上的自然变异, 精确的天气预报变得越来越重要。TISO 的 10~90 天周期给延伸期和次季节预报提供了很好的机会[45–46]。大气季节内振荡与短期气候异常和极端天气事件的发生有着密切的联系, 因此 TISO 的形成与传播机制及其气候影响受到气象学家的广泛重视, 成为气候动力学研究的重要前沿课题之一。
本文对印度洋区域 TISO 的北向传播事件进行分类, 并探讨不同传播类型的传播过程、特征和机制, 以期为研究季节内振荡问题提供理论依据, 并为次季节预报提供思路。
本研究使用以下时间序列长度为 33 年(1985—2017 年)的夏季(5—10 月)资料: 1)美国国家海洋和大气管理局(National Oceanic and Atmospheric Ad-ministration, NOAA)的极轨道卫星 2.5°×2.5°水平分辨率日均 OLR 资料[47]; 2)欧洲中期天气预报中心(European Centre for Medium-Range Weather Fore-casts, ECMWF)的 0.25°×0.25°水平分辨率和小时分辨率的第五代气候再分析资料(Reanalysis v5, 简称ERA5)数据集, 本文使用的 ERA5 再分析数据包括1000~100hPa 高度 10 个层次的纬向和经向风速、位势高度、相对涡度、温度和比湿度等资料。另外, 本文还使用海表面温度和海平面压力等数据。
本文使用的研究方法主要有 Lanczos 滤波法、合成分析方法、Student-t 显著性检验方法、经验正交函数(empirical orthogonal function, EOF)分析方法和 K 均值(K-means)聚类分析法等。为了提取季节内信号, 我们采取 3 个步骤: 首先, 通过去除季节周期和年际变率(年周期由 OLR 的 33 年日平均值得出, 年际变率则通过去除年周期时间序列的平均值得到), 获得 OLR 数据的日异常值; 然后, 对所得到的时间序列, 通过取 5 天的滑动平均值来消除高频天气; 最后, 将 OLR 数据应用于 Lanczos 带通滤波器[48], 提取周期为 20~90 天的季节内信号。
K 均值聚类分析方法是通过将样本分成几组相等的方差来对数据进行聚类。我们将轮廓聚类系数作为评估聚类分析结果相关性的指标, 用来测量每个聚类样本和相应聚类质心之间的“相似性”。样本的轮廓值范围为−1~+1, 表示集群内的稠密程度(表示集群内差异小)和集群之间的离散程度(表示集群外差异大)。高轮廓值表明该样本与其所在集群匹配良好, 而与相邻集群匹配较差。同时, 我们将轮廓值低于 0.05 的样本作为“异常值”排除, 保留剩余事件, 进行合成分析[49]。
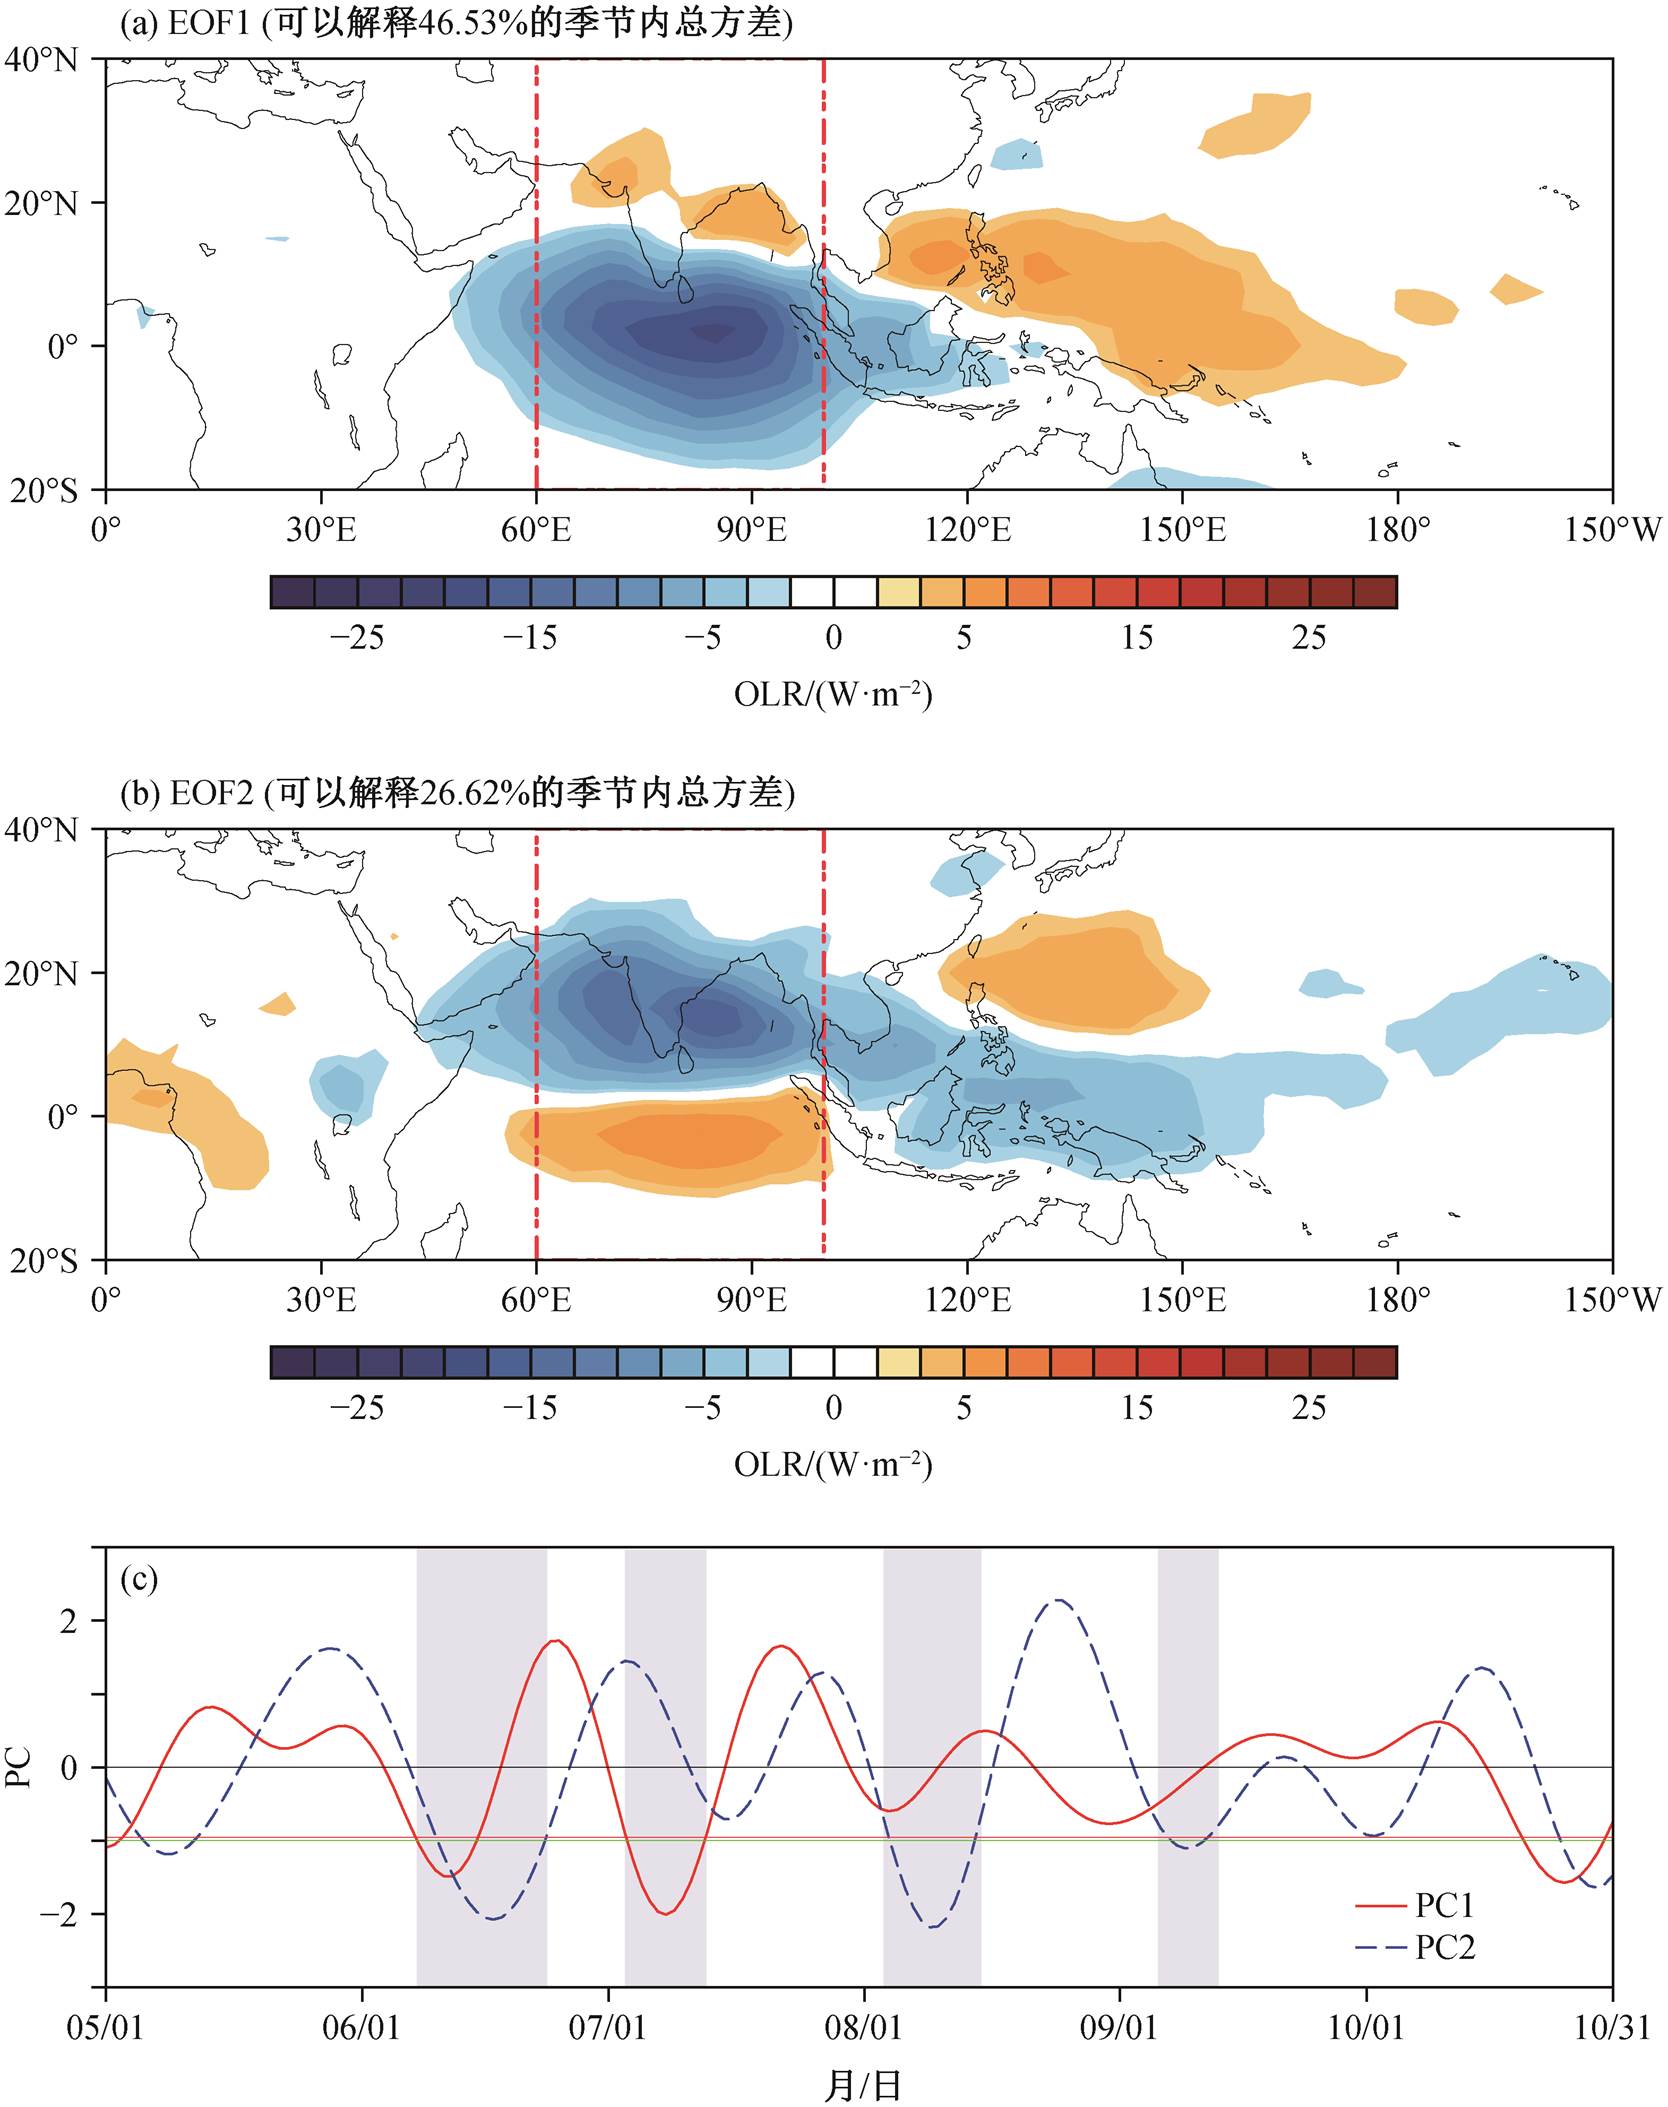
大尺度的季节内对流异常通常由 OLR 呈现, 可以代表 TISO 沿赤道带的各种传播形式。我们遵循Hirata等[50]采用的程序, 将 OLR 数据作为对流依据, 将赤道印度洋区域(20°S—20°N, 60°—100°E)33 年的季节内 OLR 异常进行经验 EOF 正交分解, 基于EOF 的两个模态, 确定 TISO 在夏季印度洋的北向传播存在 3 种类型。
如图 1(a)和(b)所示, 在赤道印度洋地区, 前两种 EOF 模式可以解释超过 70%的季节内总方差, 并且能与其他高阶模很好地分开。EOF1 表现为偶极子结构, 在印度洋上空具有显著的 OLR 异常中心。EOF2 在印度半岛以及海洋性大陆上也显示显著的OLR 异常中心。
在研究 TISO 的北向传播时, 该方法尚属首次使用。为了验证 EOF 模态提取北向传播事件的效果, 我们选取 1986 年作为示例进行检验。图 1(c)展示印度洋地区 1986 年 5—10 月 OLR 异常的前两个EOF 模态的时间序列, 根据 EOF1 与 EOF2 主成分(PC1 与 PC2)之间的关系, 定义以下 3 种传播类型。
第一种传播类型: PC1 小于一倍标准差, 且 25天内 PC2 也出现小于一倍标准差的情况。
第二种传播类型: PC1 小于一倍标准差, 25 天内PC2 无需出现小于一倍标准差的情况。
第三种传播类型: PC2 小于一倍标准差, 且 25天内 PC1 不出现小于一倍标准差的情况。
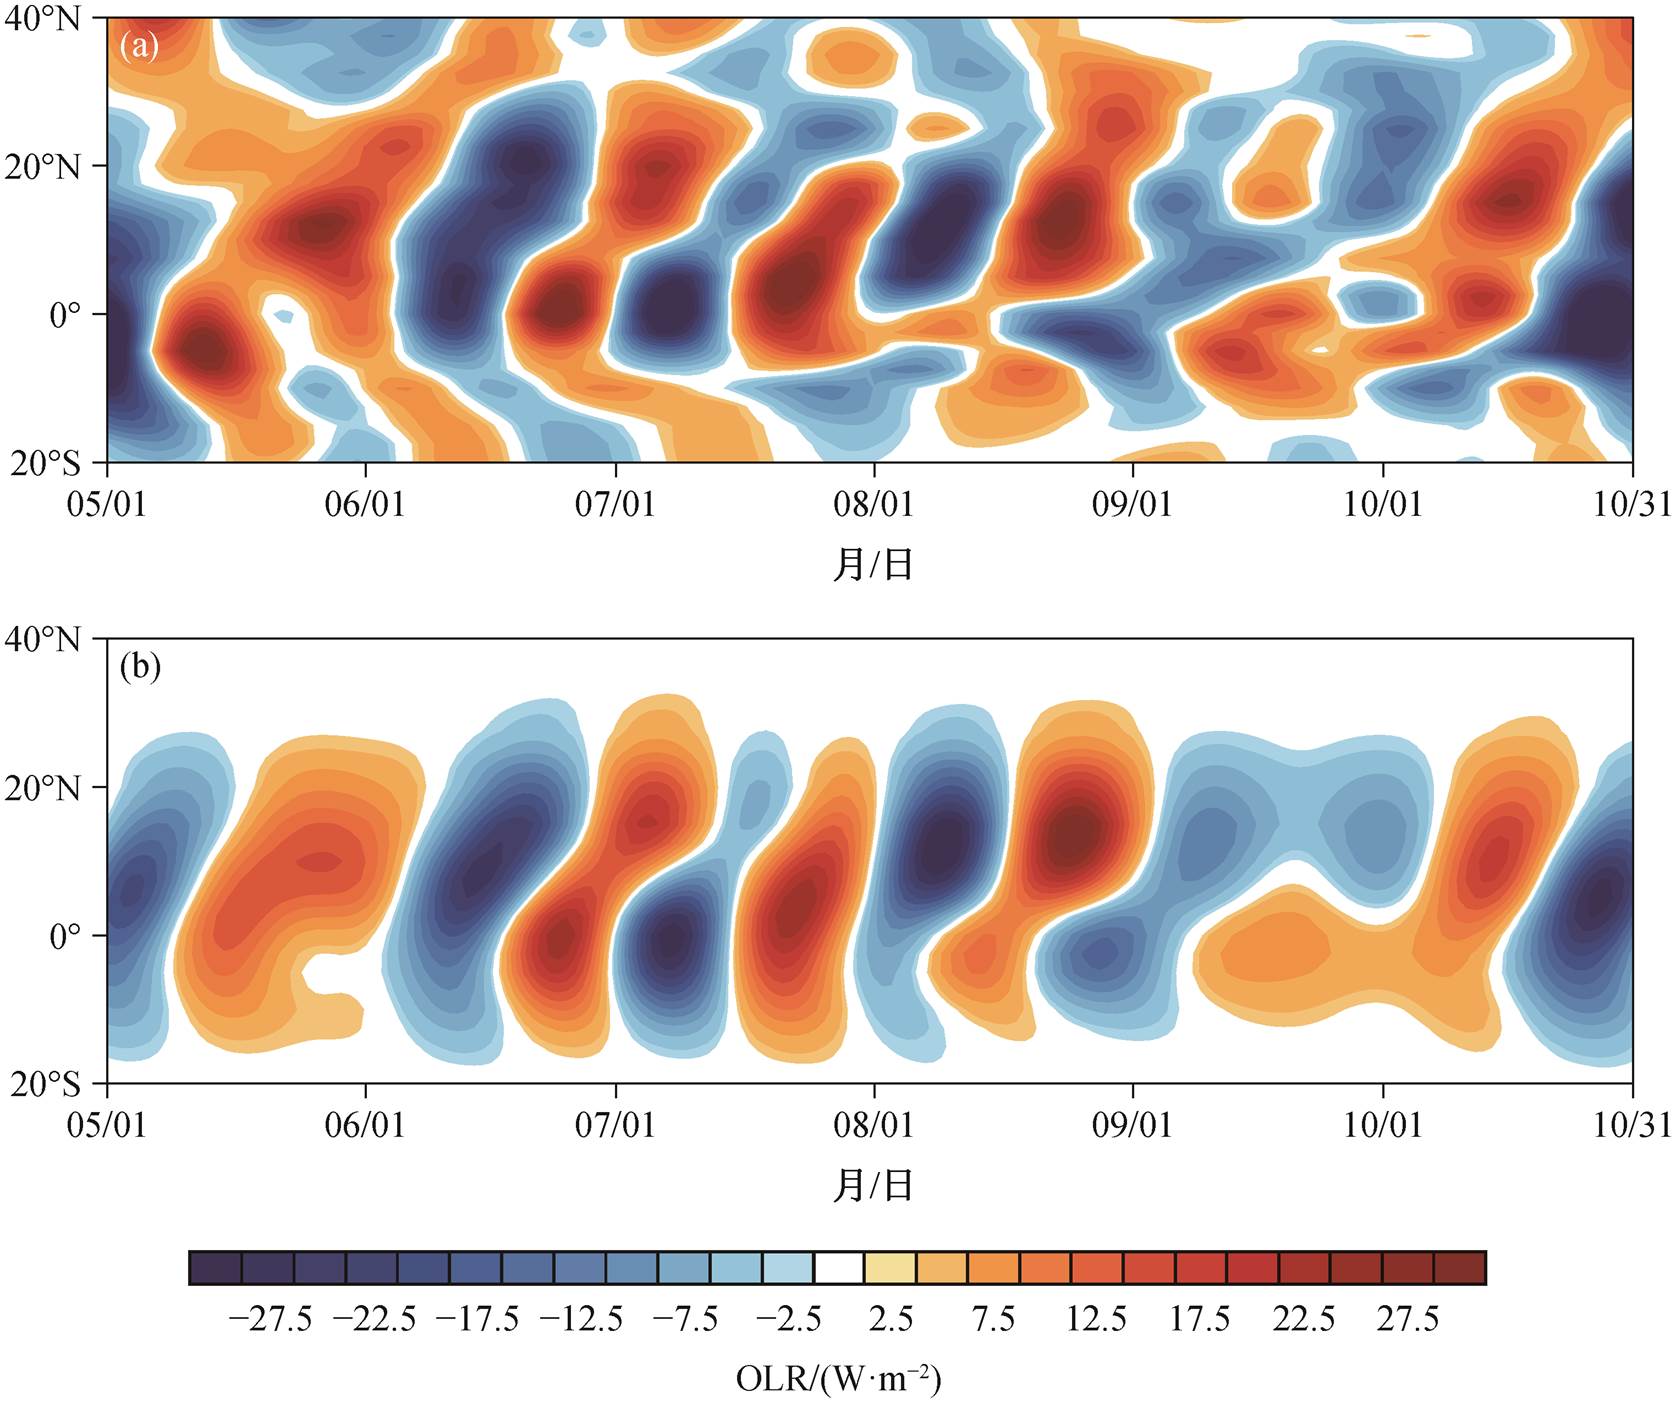
通过对比 1986 年夏天原始 OLR 异常与前两个模态重建的 OLR 异常场(图 2), 将 OLR 异常回归到每个时间序列上, 以便显示完整的 OLR 异常场。从图 2 可以看到, 1986 年夏季在印度洋地区有活跃的TISO 北向传播事件, 前两个 EOF 模式重建的异常场能够很好地捕捉赤道印度洋区域内异常对流的主要特征, 大部分的高频分量都能被过滤掉。图 2(b)重建的异常场可以很好地展现 1986 年夏季赤道印度洋区域前两个 EOF 模式的主成分(PC)的空间结构。因此, 我们认为该方法也适用于 TISO 北向传播的分类, 并由此确定夏季印度洋区域的 142 次TISO 北向传播事件。
我们利用 K 均值聚类分析方法, 将这些北向传播事件集群进行分类, 同时是对上述结果的客观验证。通过计算夏季印度洋区域所有事件 K 均值聚类分析的轮廓系数, 选择对两个区域内 TISO 北向传播事件最佳的 3 个聚类, 与经验分析的类型数目是一致的。将轮廓值低于 0.05 的聚类成员视为“比较差”的聚类(共计 10 个) , 通过去除这些“异常值”, 赤道印度洋剩余 132 个事件保留在 3 个集群中, 再将两种分类结果进行比对筛选, 最终确定 122 个 TISO北向传播事件。
对 122 个事件进行合成分析, 结果如图 3 所示。第一类北向传播的 TISO 对流中心位于赤道附近, 复合向北传播对流夹在两个强劲的向北传播干相之间, 能够从赤道地区稳定地向北传播到 30°N 附近。第二类北向传播的 TISO 对流中心也在赤道附近, 并且基本上局限在赤道地区。第三类北向传播的TISO 对流中心位置偏北, 大致位于 13°N, 对流信号从赤道附近开始, 可以向北传播到 35°N附近, 在20°N 附近强度最大, 且紧接着有另一个北向传播TISO 事件出现, 这一结果与 Matthews[51]发现的东传 Successive-MJO 事件类似。
(a)和(b)中两条竖直红线之间的赤道印度洋地区为本文研究的主要区域, 下同
图1 1986年5—10月赤道印度洋OLR异常的EOF1和EOF2模态的空间分布和时间序列
Fig. 1 Spatial loadings of OLR anomalies regressed onto the EOF1 and EOF2 modes and time series over equatorial Indian Ocean from May to October in 1986
如表 1 所示, 第一种从赤道印度洋平稳过渡到30°N 附近的传播类型共有 80 个事件, 我们将这一类型定义为稳定型; 第二种在 15°N 以北迅速衰减的传播类型共有 21 个事件, 我们将这一类型定义为衰减型; 第三种在 20°N 以北仍显著增强的传播类型也是 21 个事件, 我们将这一类型定义为增强型。
表1 122个北方夏季热带季节内振荡北传事件
Table 1 122 northward propagation summer tropical intraseasonal oscillation events

传播类型事件数量 稳定型 80 衰减型 21 增强型 21 合计122
仅显示通过置信度为95%的显著性检验区域
图2 1986年5—10月赤道印度洋OLR的原始时间–纬度分布(a)与前两个主要EOF模态重建的OLR异常场(b)
Fig. 2 Time–latitude plot of the observed anomalous OLR (a) and OLR anomalies reconstructed from the leading two EOF modes (b) over equatorial Indian Ocean from May to October in 1986
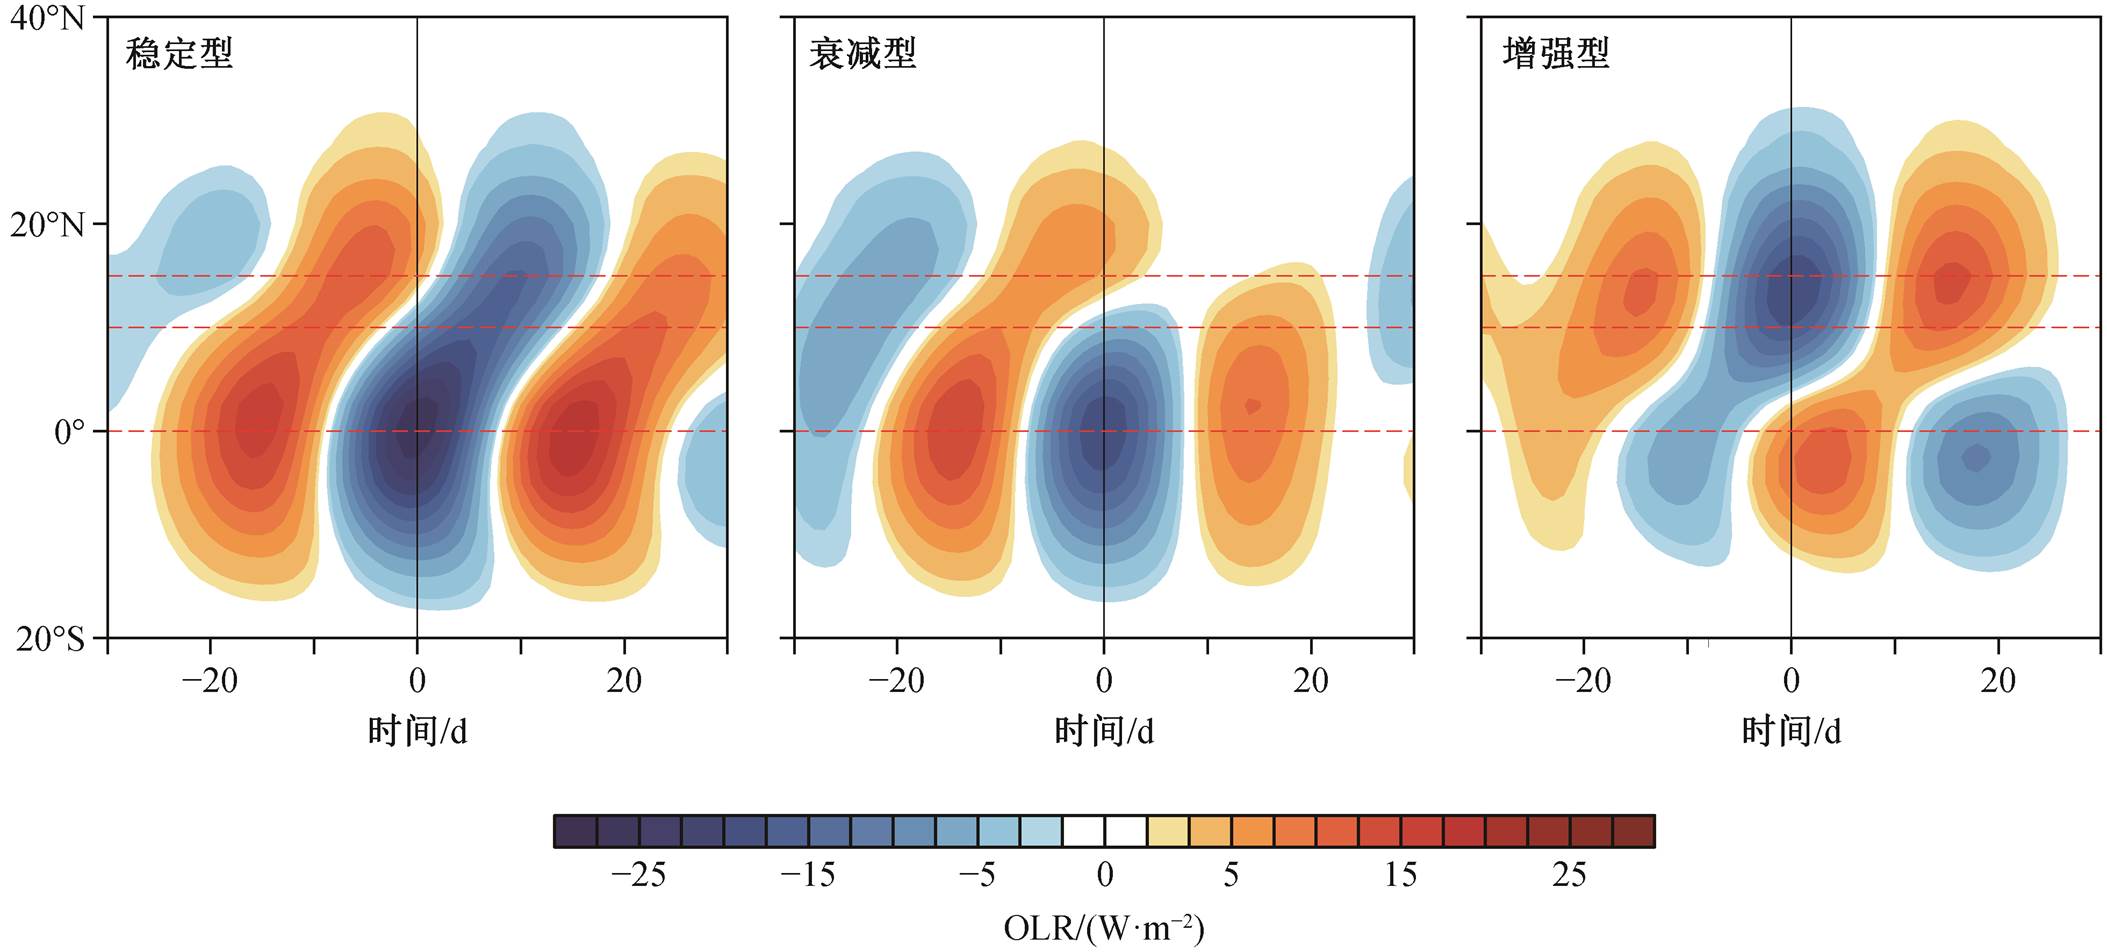
红色虚线示意对流中心的纬度
图3 赤道印度洋稳定型、衰减型和增强型传播事件OLR异常的合成时间–纬度分布
Fig. 3 Composite time–latitude sections of observed OLR anomalies for stable, attenuated and enhanced propagation types over equatorial Indian Ocean
对流层平均气流的垂直切变是亚洲夏季风的显著特征之一, Wang 等[38]指出, 在典型亚洲夏季季风系统存在的情况下, 东风垂直切变导致正压散度与斜压散度之间相互作用, 从而影响正压涡度。正的涡度异常在对流信号以北, 同时伴随斜压散度和负的涡度异常。这也会造成罗斯贝波向赤道外扩散, 从而又使这两者耦合, 所产生的正压分量引起边界层辐合。这种负反馈循环为对流的北向传播创造了条件。
如图 4 所示, 两条竖直红线之间的赤道印度洋地区是对流事件发生的主要区域, 在 3 种传播类型的生命周期中, 稳定型的对流信号起源于赤道以南, 印度洋西部, 在赤道位置对流信号达到最强, 且稳定地向北传播至印度半岛北部; 衰减型的前期与稳定型相似, 但在赤道以北信号减弱, 至孟加拉湾附近迅速衰减; 增强型的前期在赤道附近信号较弱, 但稳定地向北传播, 大约 10 天后, 对流信号从印度半岛南部开始显著增强, 到 10°N 达到最大强度, 并发展至喜马拉雅山脉以南。同时, 在 3 种类型的对流北向传播过程中, 都表现出对罗斯贝波的响应, 对流附近的气旋环流, 对流上空有西风异常, 对流以北有东风异常。
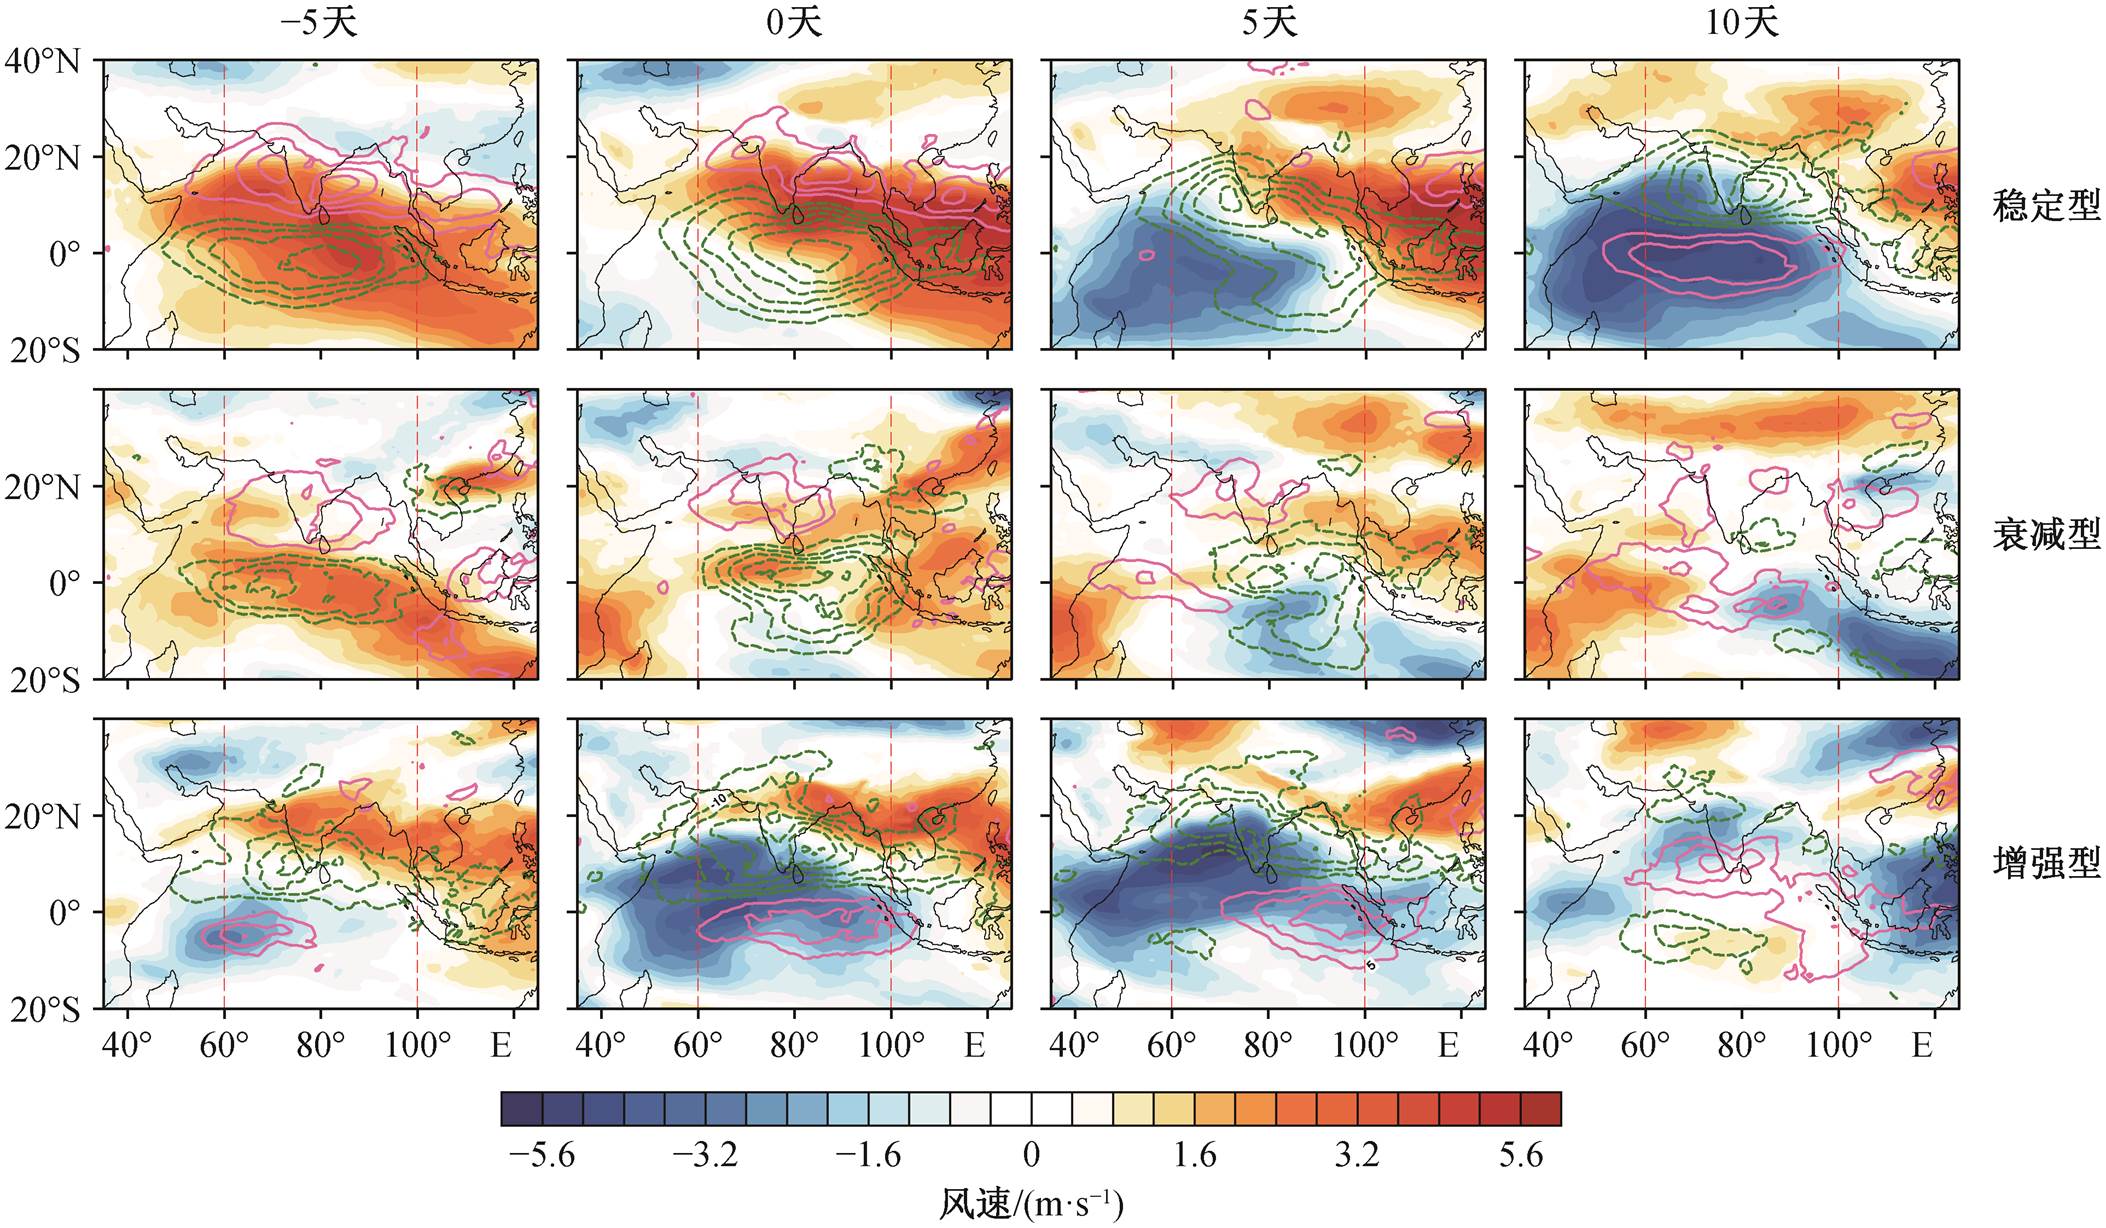
背景环流可以显著地影响罗斯贝波响应。我们用 200hPa 和 850hPa 纬向风的差值来计算东风切变, 结果如图 5 所示。稳定型传播事件在第 5 天之后有显著的背景东风切变, 有正压涡度在对流北面, 增强型传播事件的东风切变异常则在第 0 天就存在, 但衰减型传播过程中并未出现东风切变异常, 正压涡度也不在对流北侧。因此, 我们推断背景东风切变增强了对流北侧的正压涡度, 给 TISO 北向传播提供持续的动力。
风应力驱动的海洋过程也会通过影响海温而造成对流北向传播。海洋表层具有与大气对流相协调的演化过程, 尤其是 SST 的演化可能对大气对流具有反馈作用, 海表面温度正异常影响地表气温, 并使低层大气不稳定, 有利于对流活动和地面辐合。Fu 等[52]指出, 在 TISO 的北向传播阶段, SST 的正异常在北侧领先对流活动, 可能通过蒸发作用加湿底层大气, 从而对 TISO 的北向传播具有正反馈。
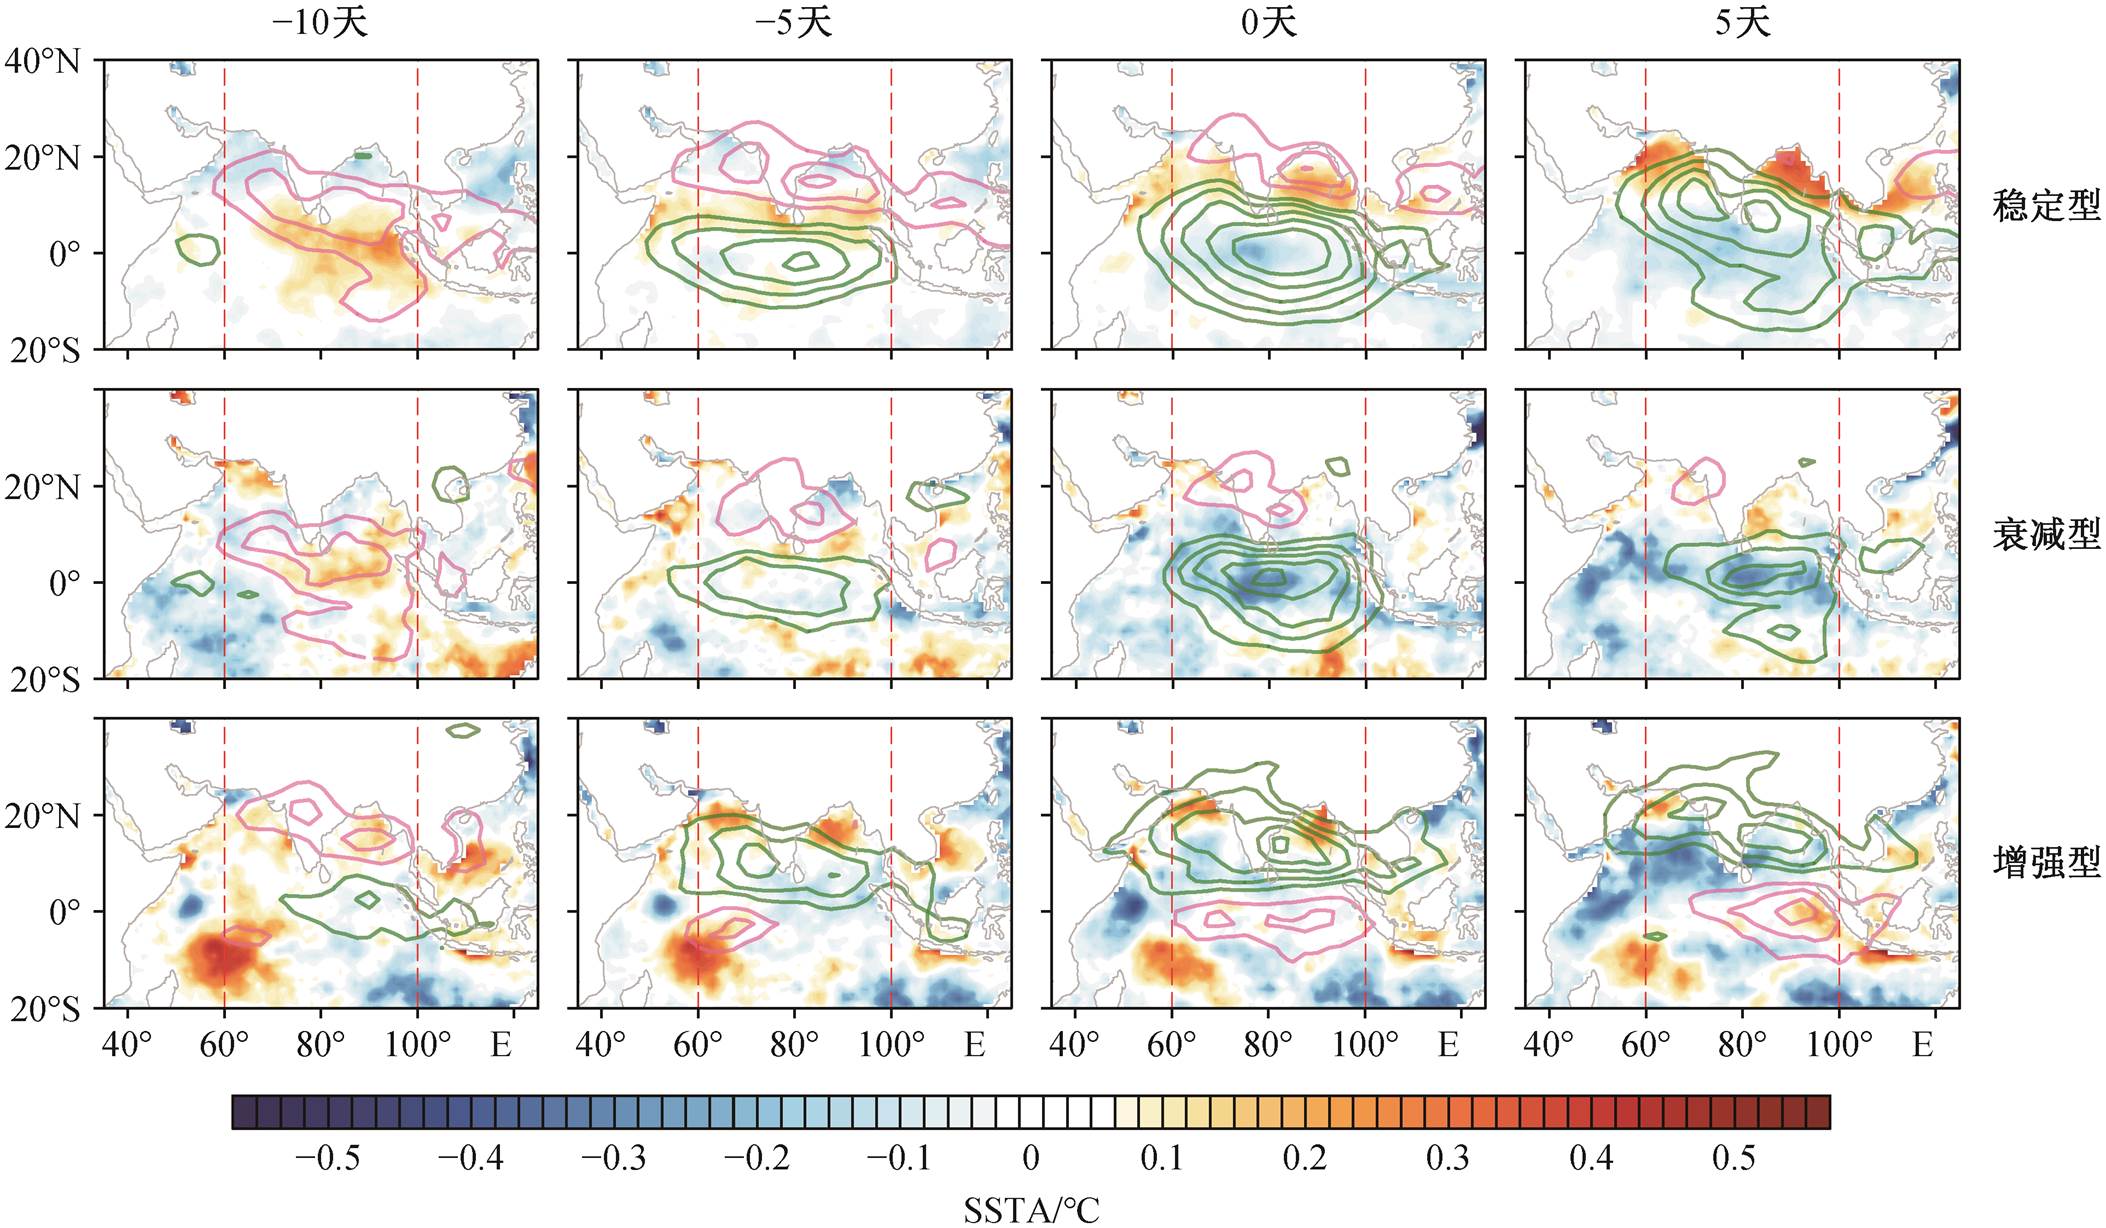
我们选取对流事件第−10 天、第−5 天、第 0 天和第 5 天 4 个时间段, 对北向传播事件的 SST 异常场进行分析, 印度洋地区 3 类 TISO 海温异常(sea surface temperature anomaly, SSTA)的时空演变如图6 所示。稳定型传播事件的对流中心在第−10 天还未形成, 赤道地区已经出现集中的海温正异常, 在−5~5 天, 海温正异常依然维持在对流中心北侧, 将造成对流中心的持续传播。衰减型传播事件在第−10 天存在分散且较弱的海温正异常, 并在未来 5天减弱, 第 0 天已经在对流中心出现海温负异常, 并持续至 5 天后, 由于没有持续的海温正异常提供稳定的海–气之间温差, 该类型在赤道印度洋生成后, 向北的传播逐渐衰减。增强型传播事件在第−10 天已经存在活跃的对流中心, 但位置偏南, 在南半球, 且强度较弱。该处的海温正异常出现在对流南侧, 因此可能是造成增强型事件前期信号不明显的原因。到第−5 天, 对流北侧印度半岛两侧也出现海温正异常, 并在未来 5 天持续, 到第 5 天对流已经登陆印度半岛, 对流南侧也出现海温负异常, 但由于陆地上的情况非常复杂, 海、陆传播有差异, 所以整个北向传播受到的海温异常影响不如海洋上那样大。
海表面相对湿度以及大气的稳定性等不同的大气条件, 可能在赤道印度洋对流向北移动中也起着至关重要的作用。我们对 1000~700hPa 的边界层散度、OLR 及比湿度进行积分, 结果如图 7 所示。为了便于观察三者之间的关系, 我们将 OLR 数据乘以5, 与散度和比湿度在相近值域进行比较。图 7 显示, 边界层比湿度大, 且三者异常极值基本上处于同一纬度。稳定型传播和衰减型传播的−5~0 天以及增强型传播的第−5 天会加强对流, 灰色阴影区则是边界层的辐合和增湿在北侧领先于强对流, 在稳定型的第 5 天和增强型的第 0 天之后出现, 诱导对流向北移动。衰减型传播中未出现强度较大且领先对流的辐合和增湿。
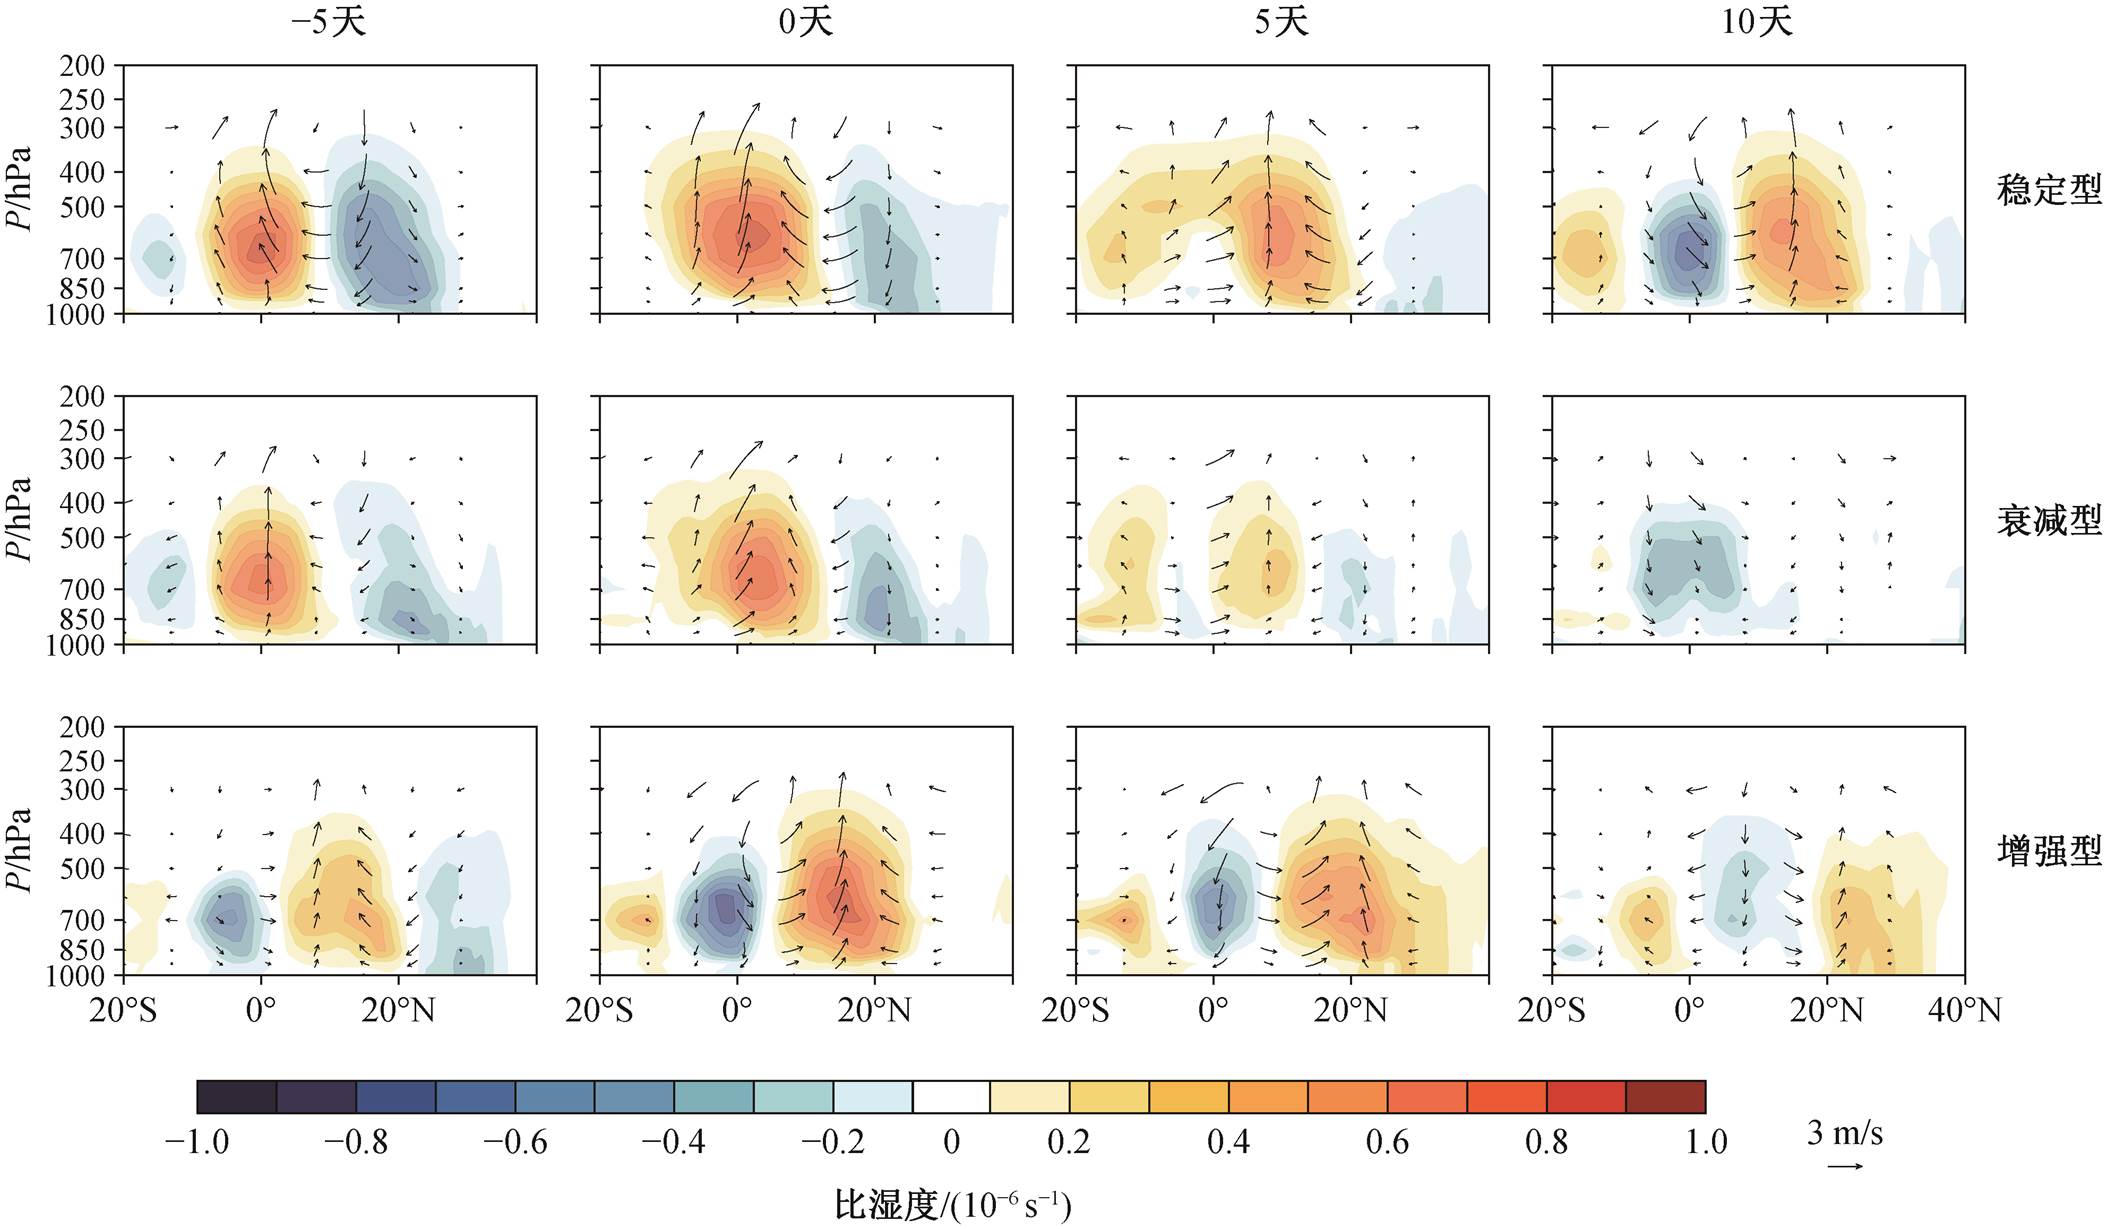
我们对边界层水汽扰动的不对称配置进行分析, 探究赤道印度洋区域(60°—100°E)从高空 200 hPa 到近地面 1000hPa 的整层运动和湿度条件。图8 显示, 稳定型传播的第 0 天, 赤道地区存在高空辐散与低空辐合, 且边界层辐合向北发展, 同时存在持续增湿且向北发展, 第 0 天时湿度异常最强, 之后逐渐减弱, 但可以到达 20°N以北; 衰减型传播的低层异常辐合非常弱, 赤道上空在−5~0 天出现微弱的辐合异常中心, 但很快消失, 对应的水汽过程仅在−5~0 天在赤道边界层有明显的正湿度异常, 到第5 天已经很弱; 增强型传播在第 0 天和第 5 天也出现低层异常辐合, 且向北移动, 第−5 天开始比湿度缓慢北移且增强, 第 0 天达到最大强度。可见, 底层大气比湿的提高以及大气对流不稳定性的不断增强都会增强对流强度, 但只有在对流北侧的扰动会使对流向北传播。
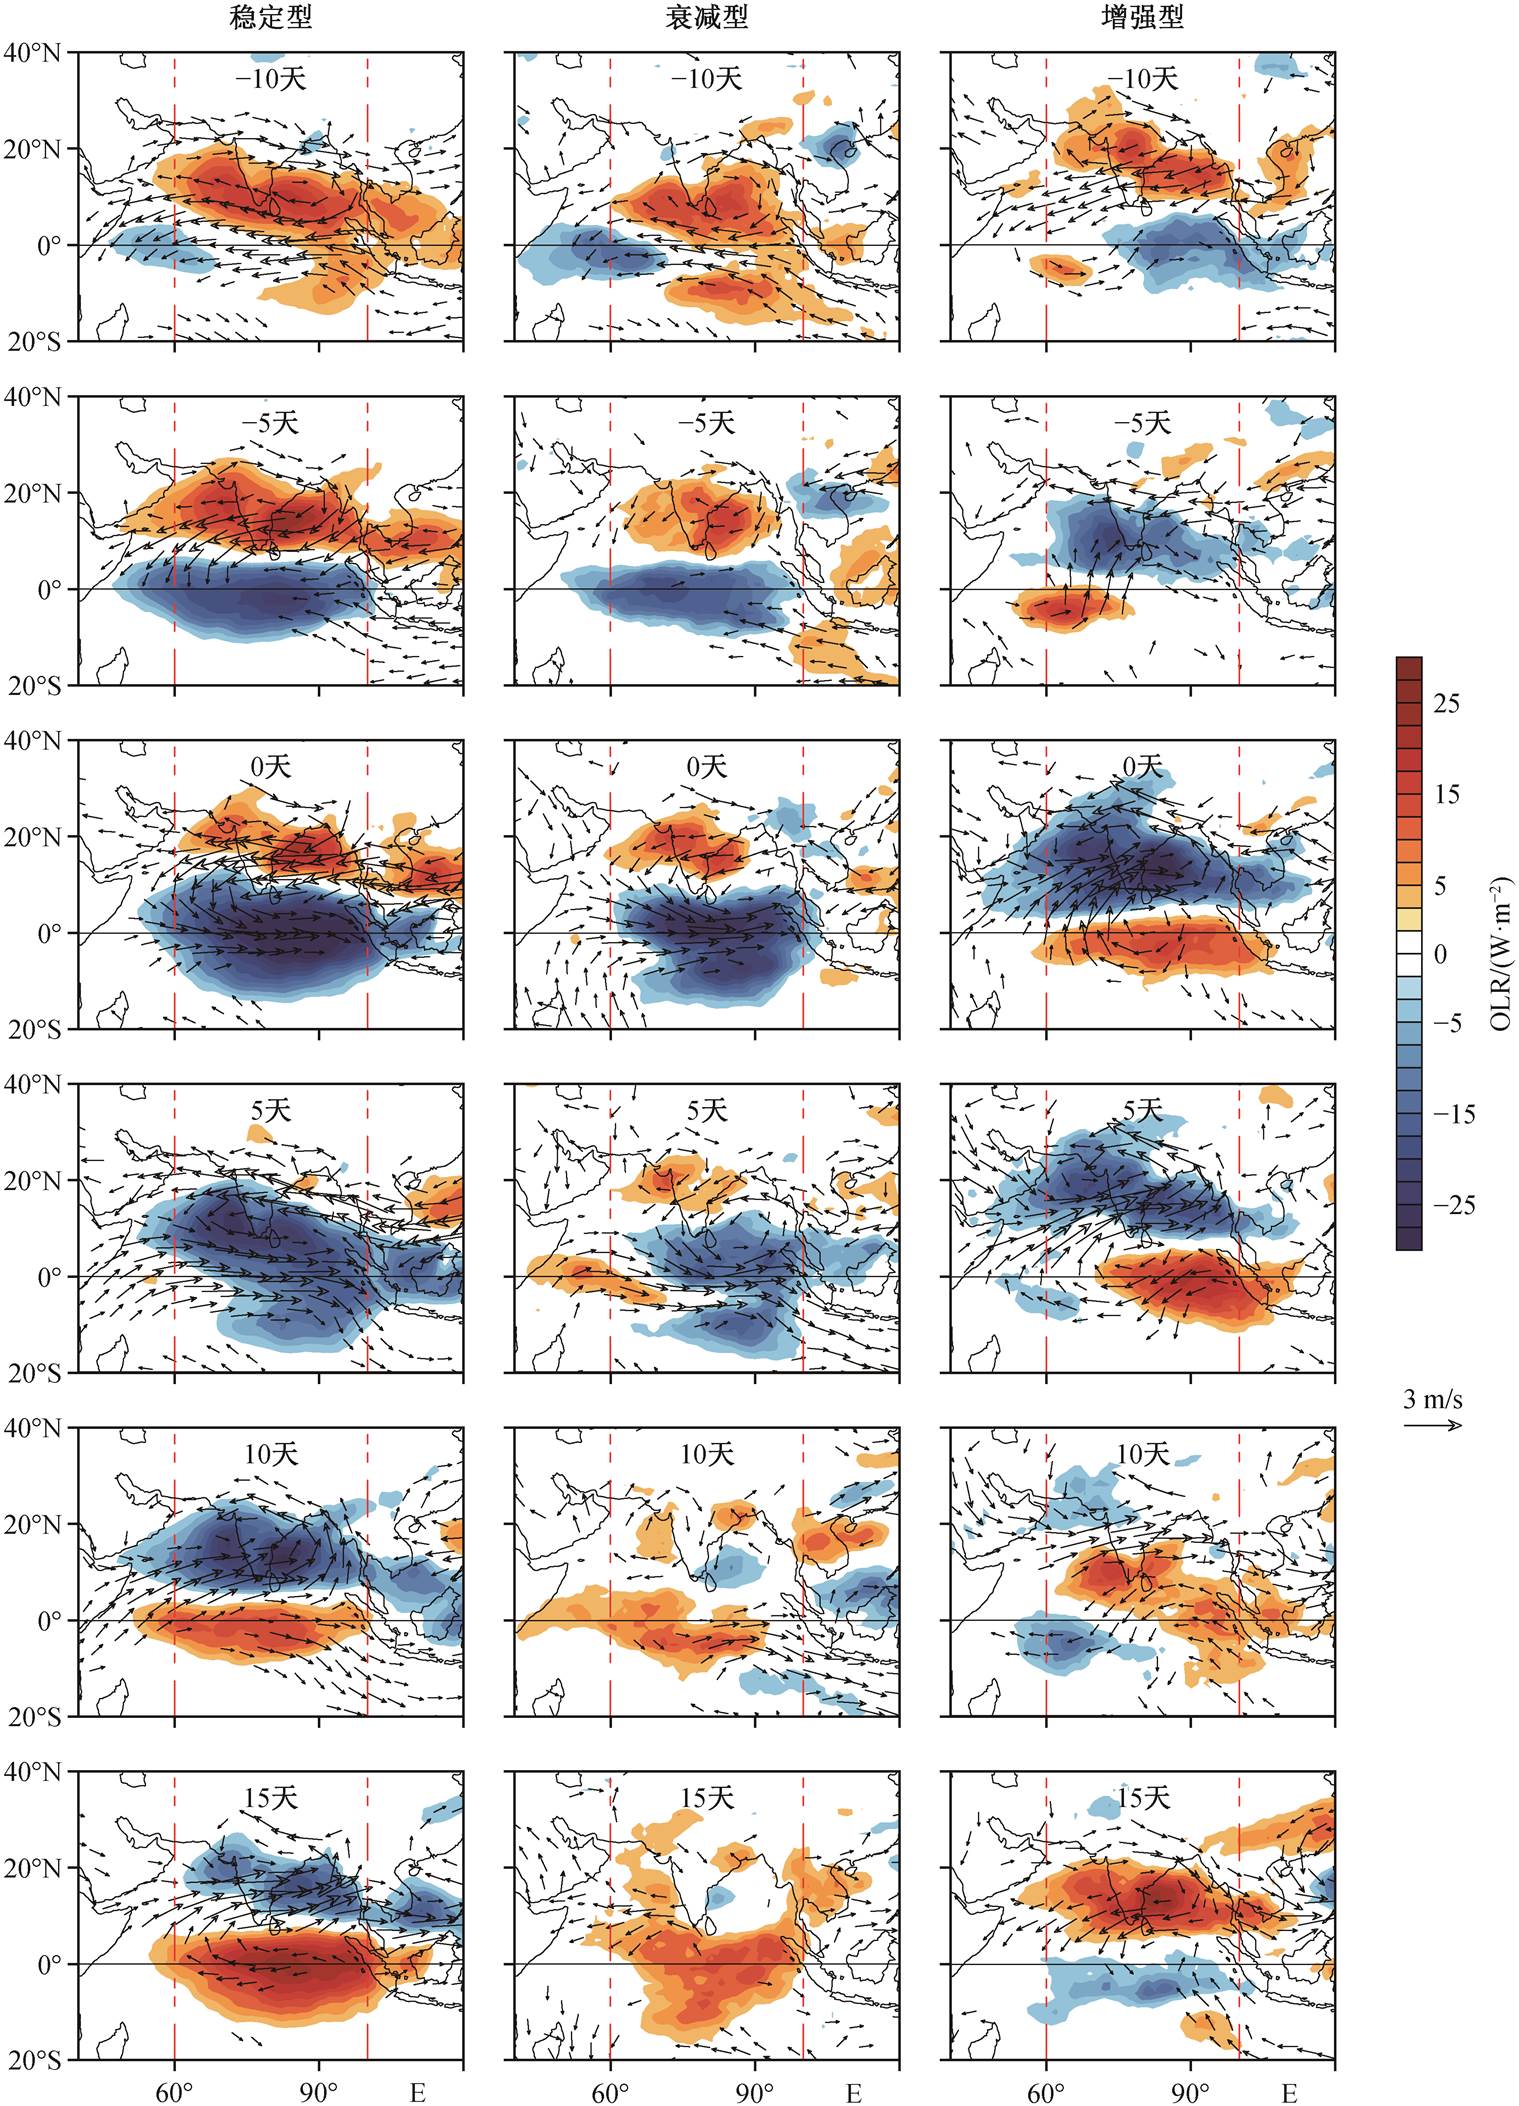
仅显示通过置信度为95%的显著性检验区域
图4 赤道印度洋稳定型、衰减型和增强型传播−10~15天的OLR异常以及850 hPa风异常的复合时空演变
Fig. 4 Composite spatial-temporal evolutions of OLR anomalies and 850 hPa anomalous winds for stable, attenuated and enhanced propagation types over equatorial Indian Ocean from composite day −10 to day 15
红线表示OLR正异常, 仅画出数值大于6 W/m2的部分; 绿线表示OLR负异常, 仅画出数值小于−6 W/m2的部分
图5 赤道印度洋稳定型、衰减型和增强型传播−5~10天的OLR异常以及背景纬向风切变的复合时空演变
Fig. 5 Composite spatial-temporal evolutions of OLR anomalies and vertical shear of background zonal winds for stable, attenuated and enhanced propagation types over equatorial Indian Ocean from composite day −5 to day 10
红线表示OLR正异常, 绿线表示OLR负异常, 间隔6 W/m2; 仅显示通过置信度为95%的显著性检验区域
图6 赤道印度洋稳定型、衰减型和增强型传播−10~5天的OLR异常和海温异常的复合时空演变
Fig. 6 Composite spatial-temporal evolutions of OLR anomalies for stable, attenuated and enhanced propagation types over equatorial Indian Ocean from composite day −10 to day 5

黑色曲线为OLR异常积分(乘以5, 单位: W/m2), 蓝色曲线为水平散度积分(经过五点滑动平均处理, 单位: 10−6 s−1), 橙色曲线为比湿度积分(单位: g/kg); 阴影区存在相对较强的边界层辐合和对流, 灰色阴影区3个数值的极值在同一纬度出现, 浅蓝色阴影区3个数值的极值先后出现
图7 赤道印度洋稳定型、衰减型和增强型传播−5~10天的OLR异常、水平散度和比湿度的边界层(1000~700 hPa)积分
Fig. 7 Boundary layer integrated (1000–700 hPa) specific humidity, horizontal divergence and OLR anomalies for stable, attenuated and enhanced propagation types over equatorial Indian Ocean from composite day −5 to day 10
仅显示通过置信度为95%的显著性检验区域
图8 赤道印度洋稳定型、衰减型和增强型传播−5~10天的比湿度异常和异常风场垂直结构时间演变
Fig. 8 Composites of the latitude-height structure of horizontal specific humidity anomalies and the anomalous wind vectors for stable, attenuated and enhanced propagation types over equatorial Indian Ocean from composite day −5 to day 10
本研究利用 33 年(1985—2017 年)卫星资料的OLR 数据以及欧洲数值预报中心最新的再分析资料 ERA5 中的单层和多尺度高分辨率气象资料, 详细地探讨热带夏季(5—10 月)季节内振荡北向传播模式的多样性及机制, 得到如下结论。
1)本文将赤道印度洋地区(60°—100°E, 20°S—40°N)的 122 个典型 TISO 北向传播事件划分为 3 种类型。稳定型: 对流信号起源于赤道以南, 在赤道位置对流信号达到最强, 且稳定地向北发展, 直至印度半岛甚至更北。衰减型: 对流信号也在赤道地区达到最大, 但在赤道以北信号减弱, 到达陆地附近就会消失。增强型: 在赤道地区前期对流信号弱, 但不断增强, 传播到 10°N 时达到最大强度, 并稳定地向北传播。
2)TISO 北向传播的多样性与海表温度异常、大气内部过程以及边界层水汽扰动的不对称性均相关。热带对流以及深厚的东风纬向切变相互作用为稳定型和增强型的北向传播提供了持续的动力。对流事件北侧显著的海温正异常通过蒸发作用加湿底层大气, 从而对 TISO 的北向传播产生正反馈作用。这一机制在稳定型和衰减型的赤道传播过程中都有所体现, 增强型传播过程中则在对流南侧更显著, 这会抑制对流的北向传播。边界层的水平散度异常会影响对流的稳定性, 使对流向北发展, 在稳定型事件的前期和后期、衰减型的前期以及增强型事件发生时均有显著的影响。
参考文献
[1] Madden R A, Julian P R. Detection of a 40–50 day oscillation in the zonal wind in the tropical Pacific. American Meteorological Society, 1971, 28: 702–708
[2] Madden R A, Julian P R. Description of global-scale circulation cells in the tropics with a 40–50 day period. American Meteorological Society, 1972, 29: 1109–1123
[3] 谢义炳, 陈受钧, 张一良, 等. 东南亚基本气流与台风发生的一些事实的杭针与分析. 1963, 33(2): 206–217
[4] Yasunari T. Cloudiness fluctuations associated with the northern hemisphere summer monsoon. Journal of the Meteorological Society of Japan, Ser II, 1979, 57(3): 227–242
[5] Murakami M. Analysis of summer monsoon fluctua-tions over India. Journal of the Meteorological Society of Japan, Ser II, 1976, 54(1): 15–31
[6] Hartmann D L, Michelsen M L, Stephen A K. Seasonal variations of tropical intraseasonal oscillations: a 20–25-day oscillation in the western pacific. American Meteorological Society, 1992, 49: 1277–1289
[7] Singh B, Kinter J L.Tracking of tropical intraseasonal convective anomalies: 1. seasonality of the tropical intraseasonal oscillations. Journal of Geophysical Re-search: Atmospheres, 2020, 125(3): doi: 10.1029/2019 JD30873
[8] Taraphdar S, Zhang F, Leung L R, et al. MJO affects the monsoon onset timing over the indian region. Geophysical Research Letters, 2018, 45(18): 10011–10018
[9] Shao X, Huang P, Huang R H. Role of the phase transition of intraseasonal oscillation on the South China Sea summer monsoon onset. Climate Dynamics, 2015, 45(1/2): 125–137
[10] Wu R G. Subseasonal variability during the South China Sea summer monsoon onset. Climate Dynamics, 2010, 34(5): 629–642
[11] Moon J Y, Wang B, Lee S S, et al. An intrasea- sonal genesis potential index for tropical cyclones during northern hemisphere summer. Journal of Cli-mate, 2018, 31(22): 9055–9071
[12] Huang P, Chou C, Huang R H. Seasonal modulation of tropical intraseasonal oscillations on tropical cyc-lone geneses in the Western North Pacific. Journal of Climate, 2011, 24(24): 6339–6352
[13] Maloney E D, Hartmann D L. The Madden-Julian os-cillation, barotropic dynamics, and North Pacific tro-pical cyclone formation, part I: observations. Ameri-can Meteorological Society, 2001, 58(17): 6339–6352
[14] Hsu P C, Lee J Y, Ha K J, et al. Influences of bo- real summer intraseasonal oscillation on heat waves in monsoon Asia. Journal of Climate, 2017, 30(18): 7191–7211
[15] Moon J Y, Wang B, Ha K J, et al. Teleconnec- tions associated with northern hemisphere summer monsoon intraseasonal oscillation. Climate Dynamics, 2013, 40(11/12): 2761–2774
[16] Wang B, Webster P, Kikuchi K, et al. Boreal summer quasi-monthly oscillation in the global tropics. Climate Dynamics, 2006, 27(7/8): 661–675
[17] Chen J P, Wen Z P, Wu R G, et al. Influences of northward propagating 25–90-day and quasi-biweekly oscillations on eastern China summer rainfall. Climate Dynamics, 2015, 45(1/2): 105–124
[18] Liu F, Ouyang Y, Wang B, et al. Seasonal evolution of the intraseasonal variability of China summer preci-pitation. Climate Dynamics, 2020, 54: 4641–4655
[19] Wheeler M C, Hendon H H. An all-season real-time multivariate MJO index: development of an index for monitoring and prediction. American Meteorological Society, 2004, 132(8): 439–453
[20] Kiladis G N, Dias J, Straub K H, et al. A comparison of OLR and circulation-based indices for tracking the MJO. Monthly Weather Review, 2014, 142(5): 1697–1715
[21] Straub K H. MJO initiation in the real-time multi-variate MJO index. Journal of Climate, 2013, 26(4): 1130–1151
[22] Kikuchi K, Wang B, Kajikawa Y. Bimodal representa-tion of the tropical intraseasonal oscillation. Climate Dynamics, 2012, 38(9/10): 1989–2000
[23] Lee J Y, Wang B, Wheeler M C, et al. Real-time multi-variate indices for the boreal summer intraseasonal oscillation over the Asian summer monsoon region. Climate Dynamics, 2013, 40(1/2): 493–509
[24] Wang S, Ma D, Sobel A H, et al. Propagation cha-racteristics of BSISO indices. Geophysical Research Letters, 2018, 45(18): 9934–9943
[25] 李崇银, 龙振夏, 穆明权. 大气季节内振荡及其重要作用. 大气科学, 2003, 27(4): 518–535
[26] 杨秋明, 宋娟, 李熠, 等. 全球大气季节内振荡对长江流域持续暴雨影响的研究进展. 地球科学进展, 2012, 27(8): 876–884
[27] Chen G, Wang B. Diversity of the boreal summer intra-seasonal oscillation. Journal of Geophysical Research: Atmospheres, 2021, 126(8): e2020JD034137
[28] Wang B, Rui H. Synoptic climatology of transient tro-pical intraseasonal convection anomalies: 1975–1985. Meteorology and Atmospheric Physics, 1990, 44: 43–61
[29] Bao M, Hartmann D L. The response to MJO-like for-cing in a nonlinear shallow-water model. Geophysical Research Letters, 2014, 41(4): 1322–1328
[30] Hu Q, Randall D. Low-frequency oscillations in radi-tive-convective systems, partⅡ: an idealized model. American Meteorological Society, 1995, 52: 478–490
[31] Chang C P, Lim H. Kelvin wave-CISK: a possible mechanism for the 30–50 day oscillations. American Meteorological Society, 1988, 45: 1709–1720
[32] Wang B. Dynamics of tropical low-frequency waves: an analysis of the Moist Kelvin wave. American Me-teorological Society, 1988, 45: 2051–2065
[33] 李崇银. 南亚夏季风槽脊和热带气旋的活动与移动性CISK波. 中国科学(B辑), 1985(7): 668–675
[34] Webster P J. Mechanisms of monsoon low-frequency variability: surface hydrological effects. American Me-teorological Society, 1983, 32: 427–476
[35] Lawrence D M, Webster P J. The boreal summer intra-seasonal oscillation: relationship between northward and eastward movement of convection. American Me-teorological Society, 2002, 59(9): 1593–1606
[36] Maloney E D, Hartmann D L. The Madden-Julian os-cillation, barotropic dynamics, and North Pacific tro-ical cyclone formation, part II: stochastic barotropic modeling. American Meteorological Society, 2001, 58 (17): 2545–2558
[37] Jiang X, Li T, Wang B. Structures and mechanisms of the northward propagating boreal summer intrasea-sonal oscillation. Journal of Climate, 2004, 17(5): 1022–1039
[38] Wang B, Xie X. A model for the boreal summer intra-seasonal oscillation. American Meteorological Society, 1997, 54: 72–86
[39] DeMott C A, Stan C, Randall D A. Northward propa-gation mechanisms of the boreal summer intraseasonal oscillation in the ERA-interim and SP-CCSM. Journal of Climate, 2013, 26(6): 1973–1992
[40] Moum J N, de Szoeke S P, Smyth W D, et al. Air- sea interactions from westerly wind bursts during the november 2011 MJO in the Indian Ocean. Bulletin of the American Meteorological Society, 2014, 95(8): 1185–1199
[41] Webster P J, Bradley E F, Fairall C W, et al. The Jas-mine pilot study. Bulletin of the American Meteoro-logical Society, 2002, 83(11), 1603–1630
[42] Anderson S P, Weller R A, Lukas R. Surface buoyancy forcing and the mixed layer of the Western Pacific Warm Pool: observations and 1D model results. Jour-nal of Climate, 1996, 9(12): 3056–3085
[43] Roxy M, Tanimoto Y. Influence of sea surface tem-perature on the intraseasonal variability of the South China Sea summer monsoon. Climate Dynamics, 2012, 39(5): 1209–1218
[44] Fu X, Lee J Y, Hsu P C, et al. Multi–model MJO fore-casting during Dynamo/Cindy period. Climate Dyna-mics, 2013, 41(3/4): 1067–1081
[45] Liu X, Wu T, Yang S, et al. MJO prediction using the sub–seasonal to seasonal forecast model of Beijing Climate Center. Climate Dynamics, 2017, 48(9/10): 3283–3307
[46] Fu X, Wang B, Bao Q, et al. Impacts of initial condi-tions on monsoon intraseasonal forecasting. Geophy-sical Research Letters, 2009, 36(8): L08801
[47] Liebmann B, Smith C A. Description of a complete (interpolated) outgoing longwave radiation dataset. Bulletin of the American Meteorological Society, 1996, 77(6): 1275–1277
[48] Duchon C E. Lanczos filtering in one and two dimen-sions. Journal of Applied Meteorology (1962–1982). 1979, 18(8): 1016–1022
[49] Kaufman L, Rousseeuw P J. Finding groups in data: an introduction to cluster analysis. New York: John Wiley & Sons, 2009
[50] Hirata F E, Webster P J, Toma V E. Distinct mani-festations of austral summer tropical intraseasonal os-cillations. Geophysical Research Letters, 2013, 40 (12): 3337–3341
[51] Matthews A J. Primary and successive events in the Madden-Julian oscillation. Quarterly Journal of the Royal Meteorological Society, 2008, 134: 439–453
[52] Fu J X, Wang W, Ren H L, et al. Three different downstream fates of the boreal–summer MJOs on their passages over the maritime continent. Climate Dyna-mics, 2018, 51(5/6): 1841–1862
Characteristics of the Northward Propagation of Summer Intraseasonal Oscillation over the Tropical Indian Ocean
Abstract The propagation process and characteristics of tropical intraseasonal oscillation (TISO) in Indian Ocean from 1985 to 2017 (from May to October) are investigated using high-resolution satellite data and reanalysis data. There are three types of northward propagation of the TISO in Indian Ocean. The stable type: the convective signal is originated from the south of the equator, in the Western Indian Ocean, then steadily propagates northward to the Indian Peninsula. The attenuated type: it is similar to the stable type in the early stage, but attenuates rapidly after it propagating northward to the Bay of Bengal. The enhanced type: there is no strong convective signal in the early stage, about ten days later, the signal changes from the southern of the Indian Peninsula begin to intensify and developed the Himalayas. During the northward propagation of TISO, convective anomalies are accompanied by easterly shear anomalies, sea surface temperature (SST) anomalies and water vapor disturbances in the boundary layer, which have different effects on the three types of propagation. The positive sea surface temperature anomalies on the north side of convective events will promote the northward propagation of convection, playing a significant role in both stable and attenuated equatorial propagation processes, but the positive SST anomalies is more significant on the south side of the convective event in the enhanced type and inhibits the northward propagation of the convective event. The easterly vertical shear mechanism provides a continuous impetus for the stable propagation of the stable and enhanced types of events, with more significant effects later in the events. The disturbed water vapor in the boundary layer aggravates the instability of the atmosphere and induces the convection system to move northward before and after the stable events, the early attenuation events and the occurrence of the enhanced events. The research results can help improving the accuracy of predicting summer intraseasonal precipitation in Southeast Asia.
Key words summer; tropical intraseasonal oscillation (TISO); northward propagation; Indian Ocean; precipitation prediction