 (1)
(1)
摘要 利用三维数值模拟方法, 根据地幔对流控制方程, 以 180Ma 喷发的 Ferrar 大火成岩省(LIP)为例, 在模型中引入 Pangea 超大陆、大型横波低速带(LLSVPs)和 Pangea 超大陆边缘的俯冲带, 模拟地幔对流过程, 研究其对应地幔热柱从地球内部热边界层(例如核幔边界)的生成过程, 并讨论导致该地幔柱产生的相关因素。结果表明, LLSVPs 的形状以及俯冲带与 LLSVPs 边缘的距离对地幔柱的发生位置影响巨大; 地幔柱多起源于 LLSVPs 边缘曲率较大的位置, 并随着俯冲带与 LLSVPs 边缘的距离增加逐渐向远离 LLSVPs 边缘的方向偏移; 俯冲带的黏度影响地幔柱发生的时间, 但不影响地幔柱的位置。
关键词 三维数值模拟; 地幔柱; Ferrar大火成岩省; 俯冲带; 大型横波低速带(LLSVPs)
作为地幔对流的重要组成部分, 地幔柱对地球深部地幔以及地球表面板块构造的演化发挥着重要作用[1]。通常认为, 地幔柱由地幔底部热边界层的热不稳定物质演化而来[2‒3]。在地幔对流过程中, 热柱逐渐向地表上升, 其头部到达岩石圈底部时, 造成岩石圈部分熔融而发生弱化, 最终在地表形成大火成岩省(large igneous provinces, LIPs)[4‒6]。地球动力学研究表明, 地幔柱在板块演化, 特别是超大陆循环中发挥着重要作用。Zhang 等[7]认为, 地幔柱上升过程中对大陆岩石圈的推力作用在超大陆破裂时起主导作用, 触发超大陆的破裂。Dang 等[8]的研究表明, 地幔柱不仅触发超大陆的破裂, 其喷发位置在一定程度上也决定超大陆破裂的位置。因此, 探讨地幔柱的生成机制, 特别是地幔柱的生成位置, 对研究全球板块构造演化以及超大陆循环过程至关重要。
大火成岩省是地幔柱在地球表面的表现形式。全球大火成岩省的重建数据表明, 自 200Ma 以来, 大火成岩省在地表的喷发位置大部分集中在非洲和中太平洋区域[5,9‒15]。有关地震波速的研究表明, 非洲和中太平洋底部有两个明显的大型横波低速异常区域(large low shear velocity provinces, LLSVPs); 对大火成岩省喷发中心位置的研究显示, 深部地幔柱多起源于 LLSVPs 周围[16]。这些重建数据表明, LLSVPs 对地幔柱的生成起着重要的作用。此外, 全球俯冲带的演化也对地幔柱的生成有重要作用。Zhong 等[17]指出, 在超大陆循环过程中, 俯冲带的演化牵引所有大陆聚合成超大陆。由于超大陆具有一定程度的绝热性, 使得其底部温度升高[9,18], 俯冲带会移动到已形成超大陆的海陆边缘, 俯冲物质会重新演化, 最终形成环超大陆俯冲带[19‒20]。俯冲板片在到达核幔边界之后, 冷的物质会在核幔边界激发出向上的热柱。因此, LLSVPs 以及俯冲带对地幔柱生成机制的研究尤为重要。
为了研究地幔柱产生的动力学机制, 本文着眼于最近一期超大陆——盘古大陆(Pangea, 320~170 Ma)破裂过程中发挥重要作用的 Ferrar 大火成岩省的产生过程, 并探究相关动力学机制。Ferrar 大火成岩省的喷发时间约为 180 Ma, 位于冈瓦纳大陆东南部, 其范围从南极洲的 Transantarctic 山脉延伸至南澳大利亚(包括塔斯马尼亚)和新西兰[21‒22]。对地震波的研究显示, Ferrar 大火成岩省喷发中心的底部存在剪切横波异常区域(即 LLSVPs)[16], 俯冲带的重建资料表明澳大利亚和南极洲的东部一直存在环超大陆俯冲带[23‒24]。这些资料表明, Ferrar 热柱的生成及其位置可能受 LLSVPs 和俯冲带影响, 但其动力学机制有待探究。本文采用三维球壳模型, 模拟自 200~150Ma 以来的全球地幔演化过程, 以此探究影响 Ferrar 热柱产生的重要因素。
本文使用有限元软件 CitcomS, 构建一个三维的全球地球动力学模型。使用有限元方法和布辛内斯克近似法, 将地幔视为不可压缩流体, 用不同密度和黏度的化学物质来模拟模型中的超大陆块体, 用质量、动量、能量和化学组分守恒公式来控制地球内部的温度、速度、压强、化学组分场, 其他一些热动力学性质随深度而变化。不同化学组分间无量纲化的地幔对流控制方程[25‒26]为
(1)
 (2)
(2)
 (3)
(3)
 (4)
(4)
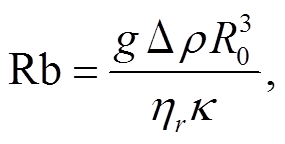
其中, u 是速度矢量, P 是(流体力学)动压强, η 是黏度,  是应变率张量, T 是温度, g 是重力加速度单位矢量, t 是时间, H 是内生热速率, C 是非均质化学组分场变量, Ra 是热瑞利数, Rb 是化学瑞利数。
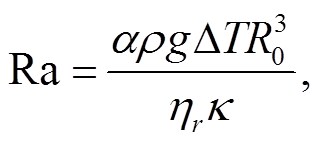
热瑞利数 Ra 定义如下:
 (5)
(5)
其中, α 是热膨胀系数, ρ 是密度, g 是重力加速度, ΔT 是边界顶部和底部的温度差, R0 是地球半径, ηr是参考黏度, κ 是热扩散系数。如果用地幔厚度 d来表示 Ra, 则需要乘上一个转换因子(d/R0)3。
内生热速率 H 的公式如下:
 (6)
(6)
其中, Q 是体积生热率, cp 是比热。
化学瑞利数 Rb 定义如下:
 (7)
(7)
其中, Δρ 是两种化学组分(大陆岩石圈, LLSVPs)与海洋地幔间的密度差。瑞利数的定义基于地球的半径而不是地幔厚度, 基于前者算出的瑞利数约为基于后者的 11 倍。
大陆岩石圈密度 B (Buoyancy ratio)是一个用于追踪化学物质密度的参数, 定义如下:
 (8)
(8)
随深度、温度和化学组分变化的无量纲化黏度计算公式为
 (9)
(9)
其中, r 是无量纲化的地球半径, η0 是随深度变化的预因子, ηC 是随化学组分变化的预因子, E 表示活化能。
表 1 列出本文所有关键参数。在模型中, 我们用 H=9.22×10⁻¹²W/kg 作为量纲来无量纲化内生热速率(换算成无量纲的数据为 100), 以便产生 65%~ 70%的内部生热量[27‒28]。瑞利数影响对流的强度, 其值越大, 对流越强烈。在模型中, 我们将 Ra 设置为 1.5×10⁸ (如果基于地幔厚度定义热瑞利数, 则Ra=1.37×10⁷), 相应的参考黏度为 5×10²¹, 使得平均水平运动速度达到 5cm/a。无量纲化的活化能 E设置为 6.907, 以便产生 103 级别的黏度变化, 使得地幔对流时保持类似地球板块的速度结构[29]。本文采用的活化能数值小于实验室的研究数据, 是为了保证模型的数值稳定性(尤其是考虑到脆性变形和非牛顿流变行为时)。
模型顶部和底部的无量纲化半径分别为 1 和0.55, 地表和核幔边界处都应用自由滑移和等温边界条件。因此, 超大陆和地幔间是自由运动和自由变形的[30]。热化学对流能力由比例示踪法实现[26,31]。视模型初始时刻为 200Ma, 这时的温度场是经过前期计算得到的初始温度场。模型中, 岩石圈被划分为 12 个部分, 每部分都在 r, θ, φ 方向上进一步划分为 64 个单元。r 方向的范围是从核幔边界到地表。我们使用的模型网格包含 12×65×65×65 个网格点。
表1 模型的关键参数
Table 1 Key parameters of the model
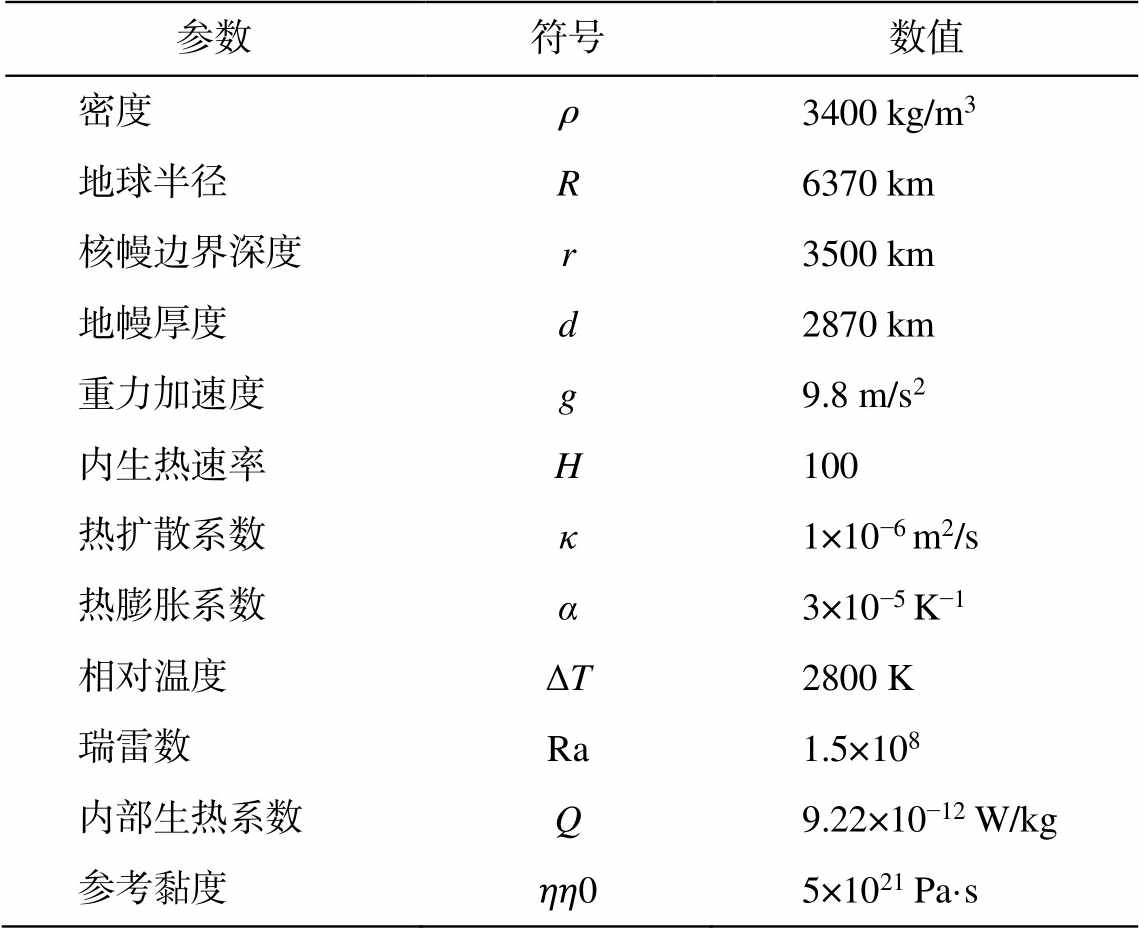
参数符号数值 密度ρ3400 kg/m3 地球半径R6370 km 核幔边界深度r3500 km 地幔厚度d2870 km 重力加速度g9.8 m/s2 内生热速率H100 热扩散系数κ1×10⁻⁶ m2/s 热膨胀系数α3×10⁻⁵ K−1 相对温度ΔT2800 K 瑞雷数Ra1.5×108 内部生热系数Q9.22×10−12 W/kg 参考黏度𝜂𝜂05×1021 Pa·s
我们在模型中引入 Pangea 超大陆为代表的大陆岩石圈(图 1), 旨在模拟在地幔对流过程中超大陆对整个地幔对流的影响。ηC 和 B 两个参数是用来区分超大陆与海洋地幔物质黏度和密度差异的关键参数, 大陆克拉通的黏度比海洋岩石圈大, 但如果ηC 过大, 会导致数值不收敛。我们将克拉通的 ηC设置为 100, 表示大陆岩石圈黏度是海洋岩石圈的100 倍[7,28,32‒33]。模型中, 参数 B 统一设置为−0.2, 对应大陆岩石圈与海洋岩石圈之间−50kg/m3 的密度差。
俯冲带是影响地幔柱生成的关键因素。200 Ma 以来, 全球俯冲带大多经历了后撤的过程[34]。为了使大陆岩石圈周围的海洋岩石圈得以俯冲, 我们选取 Matthews 等[35]在地质重建中使用的俯冲带数据, 按照重建的俯冲带出现时间和位置, 在超大陆边缘设置形状及位置随时间而变化的软弱带。软弱带的宽度为 200km, 厚度为 150km, 与海洋岩石圈的厚度相等。软弱带的黏度比海洋岩石圈小两个数量级。随着时间的演化, 软弱带的位置每 10Ma重置一次, 旨在模拟俯冲带后撤这一重要现象。
在模型的核幔边界处设置两个致密的化学物质堆作为 LLSVPs, 形状遵循 S20RTS 剪切波速异常模型[36]中 2800km 深度处−0.46%的等值线[16](图 2)。普遍认为, LLSVPs 是一个高密度化学异常层, 因此我们将 LLSVPs 的参数 B 设置为 0.7, 以便区分LLSVPs 与周围地幔, 其他物理参数与周围地幔相同。通常认为, LLSVPs 从 200Ma 就保持相对稳定的状态, 因此我们将 LLSVPs 的水平速度设为 0, 以便在模型中获得一个稳定的 LLSVPs。我们通过选取不同等值线下非洲 LLSVPs 的模型来调整 LLSVPs的范围, 以便探讨不同形状的 LLSVPs 对 Ferrar 大火成岩省对应地幔热柱生成的影响。
为了得到超大陆下方合理的地幔初始结构, 我们结合地质约束条件, 采用三步走的模拟计算方式。第一步, 在模型中放入预先计算好的初始温度剖面(该剖面经随机的存在扰动的热力学场得到), 经过一段时间的纯热对流作用后, 得到稳态的温度场(图 3(a))和黏度场剖面(图 3(b))。第二步, 将第一步得到的稳态温度场剖面作为初始温度条件, 根据俯冲带的地质重建位置, 加入软弱带, 再加入重建的 Pangea 大陆岩石圈(图 1)和核幔边界处的太平洋LLSVPs (图 2)的影响, 经过 200Ma 的作用后, 整个模型进入稳定状态。第三步, 在核幔边界引入非洲LLSVPs, 在此基础上探究 Ferrar 大火成岩省对应地幔柱的产生及相关参数的影响。
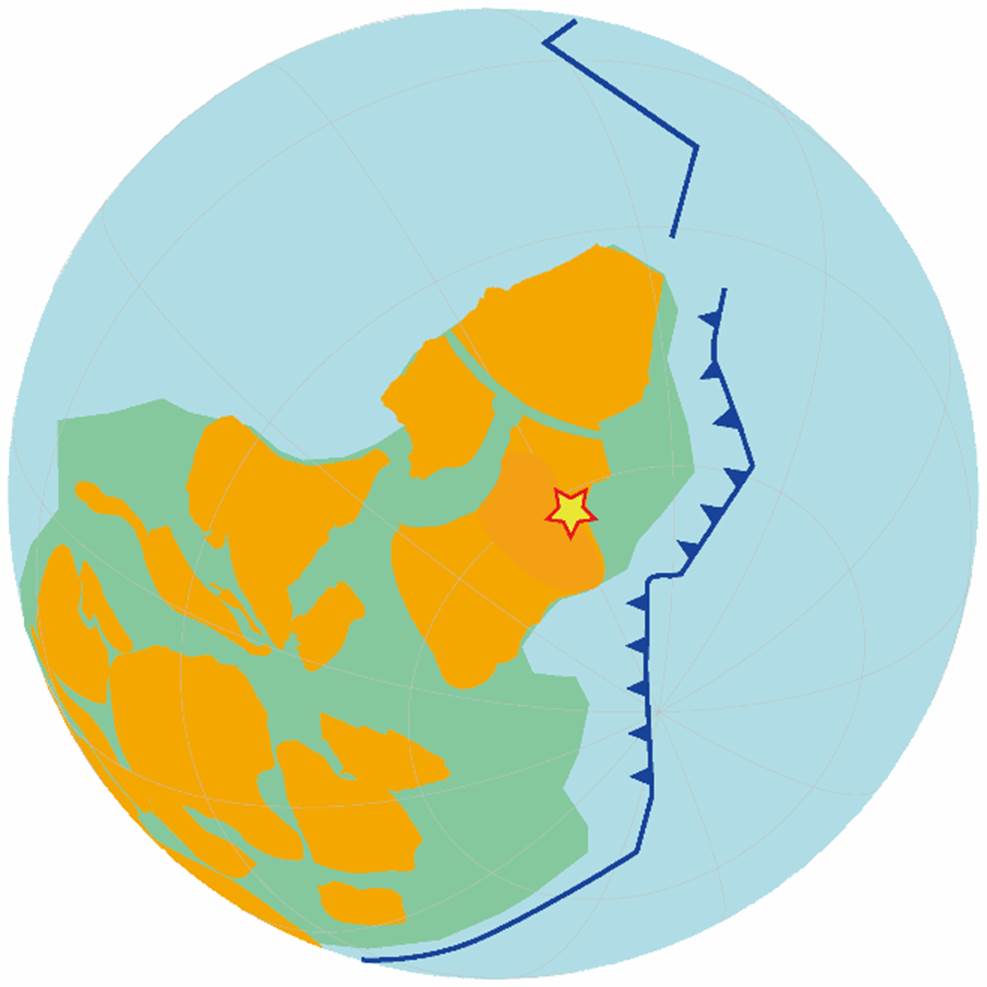
地壳年龄的大致划分根据文献[8]修改。橙色、绿色和蓝色分别代表克拉通(>1.6Ga)、造山带(<1.6Ga)和海洋岩石圈, 蓝线代表俯冲带, 星号标示Ferrar大火成岩省的喷发位置
图1 200 Ma前澳大利亚‒南极洲区域克拉通和造山带分布
Fig. 1 Distribution of orogens and cratons of Australia and Antarctica region at 200 Ma
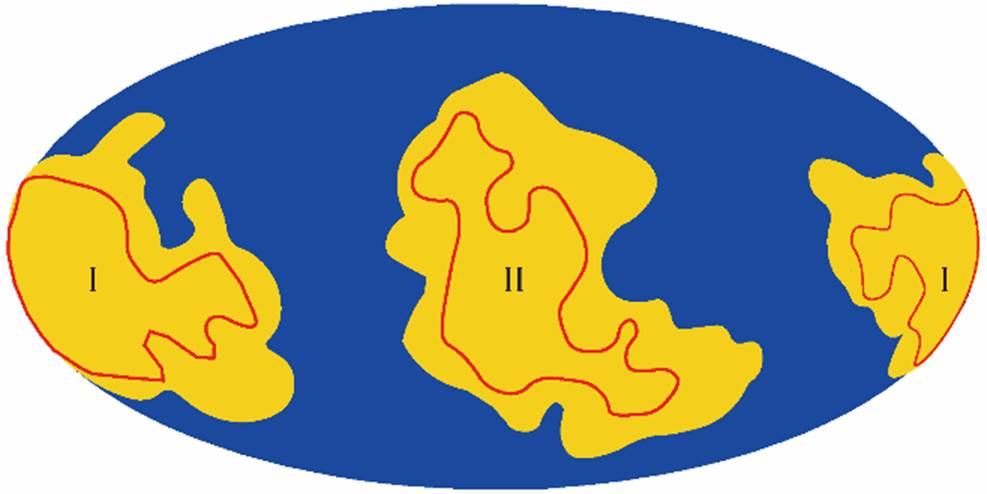
Ⅰ太平洋LLSVP; Ⅱ非洲LLSVP。黄色代表S20RTS剪切波速异常模型中 2800km 深度处−0.46%的等值线, 红色轮廓线代表S20RTS 剪切波速异常模型中 2800km 深度处−0.65%的等值线, 蓝色代表海洋岩石圈
图2 2800 km深度处全球LLSVPs设置
Fig. 2 Setting of global LLSVPs at 2800 km
模型算例及其参数见表 2。标准算例(算例 1)的模拟时间起始于 200Ma, 模型于 180Ma 左右成功地模拟产生 Ferrar 热柱。算例 1 的结果(图 4(a))显示, 澳大利亚和南极洲东南部的环超大陆俯冲带下降到核幔边界处后, 冷的物质导致非洲 LLSVPs 边界上的热物质不稳定, 进而上升成为地幔热柱。此地幔柱喷发位置位于南极洲东南部, 喷发时间约为180Ma, 可与地质历史上 Ferrar 大火成岩省(图 5)对应。图 5 显示, 模型中地幔柱喷发位置与古地理重建的大火成岩省喷发中心位置相距不到 1000km, 在一定程度上证明了模型的精确性和合理性。图4(a)显示该地幔柱的生成位置位于非洲 LLSVPs 明显凹陷的地方, 在一定程度上表明 LLSVPs 形状对地幔柱发生位置的重要性。
图3 稳态温度场剖面(a)和稳态黏度场剖面(b)
Fig. 3 Profile of steady temperature field (a) and profile of steady viscosity field (b)
表2 模型的关键参数
Table 2 Key parameters of the model
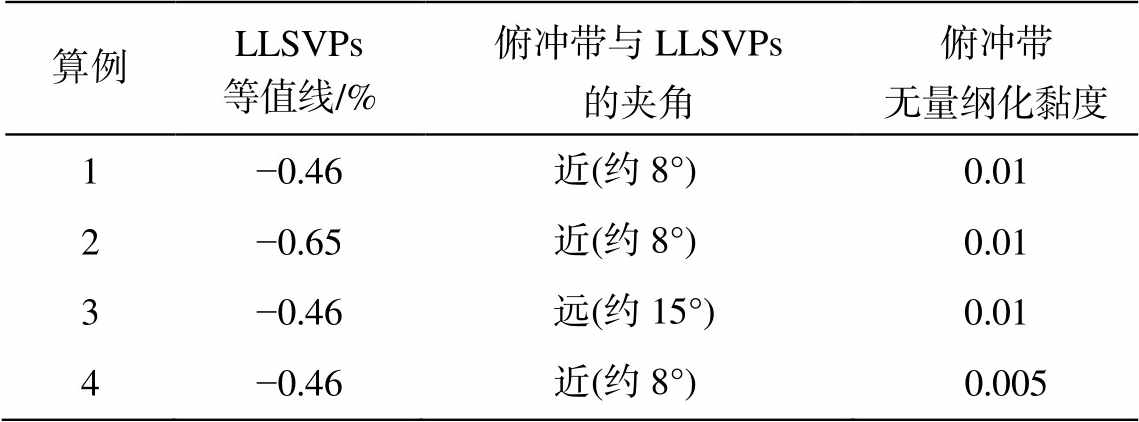
算例LLSVPs等值线/%俯冲带与LLSVPs的夹角俯冲带无量纲化黏度 1−0.46近(约8°)0.01 2−0.65近(约8°)0.01 3−0.46远(约15°)0.01 4−0.46近(约8°) 0.005
为了验证 LLSVPs 形状对地幔柱发生及其位置的影响, 我们设置对比算例(算例 2)。不同于算例1, 算例 2 采用 Torsvik 等[16]的研究中 S20RTS 剪切波速异常模型[36]在 2800km 深度处−0.65%的等值线, 其 LLSVPs 形状与算例 1 有明显区别, 在南极洲底部未见明显的凹槽(图 4(b))。算例 2 的结果显示, 在 200~150Ma 期间, 南极洲与澳大利亚破裂处未见明显的地幔柱出现。算例 1 (图 4(a))与算例 2 (图4(b))的结果对比表明, 地幔柱产生位置多发生在LLSVPs 边界的凹槽处。此模拟结果与 Torsivk 等[16]的重建结果吻合。据观察, 250Ma 至今, 75%以上的大火成岩省喷发中心位于 LLSVPs 的边缘, 而这些LLSVPs 边缘大火成岩省喷发中心的位置又多分布在 LLSVPs 形状的凹陷处。事实上, 在地幔对流过程中, 俯冲带俯冲过程中携带的冷物质到达核幔边界后会水平运移, 且 LLSVPs 的位置自 250Ma以来没有发生大的变化[16,37]。当冷的物质在运移过程中遇到 LLSVPs 边缘, 会使得周围地幔物质发生热不稳定现象, 从而激发产生热柱。LLSVPs 边缘曲率越大, 接触的冷的物质越多, 越容易产生热柱。
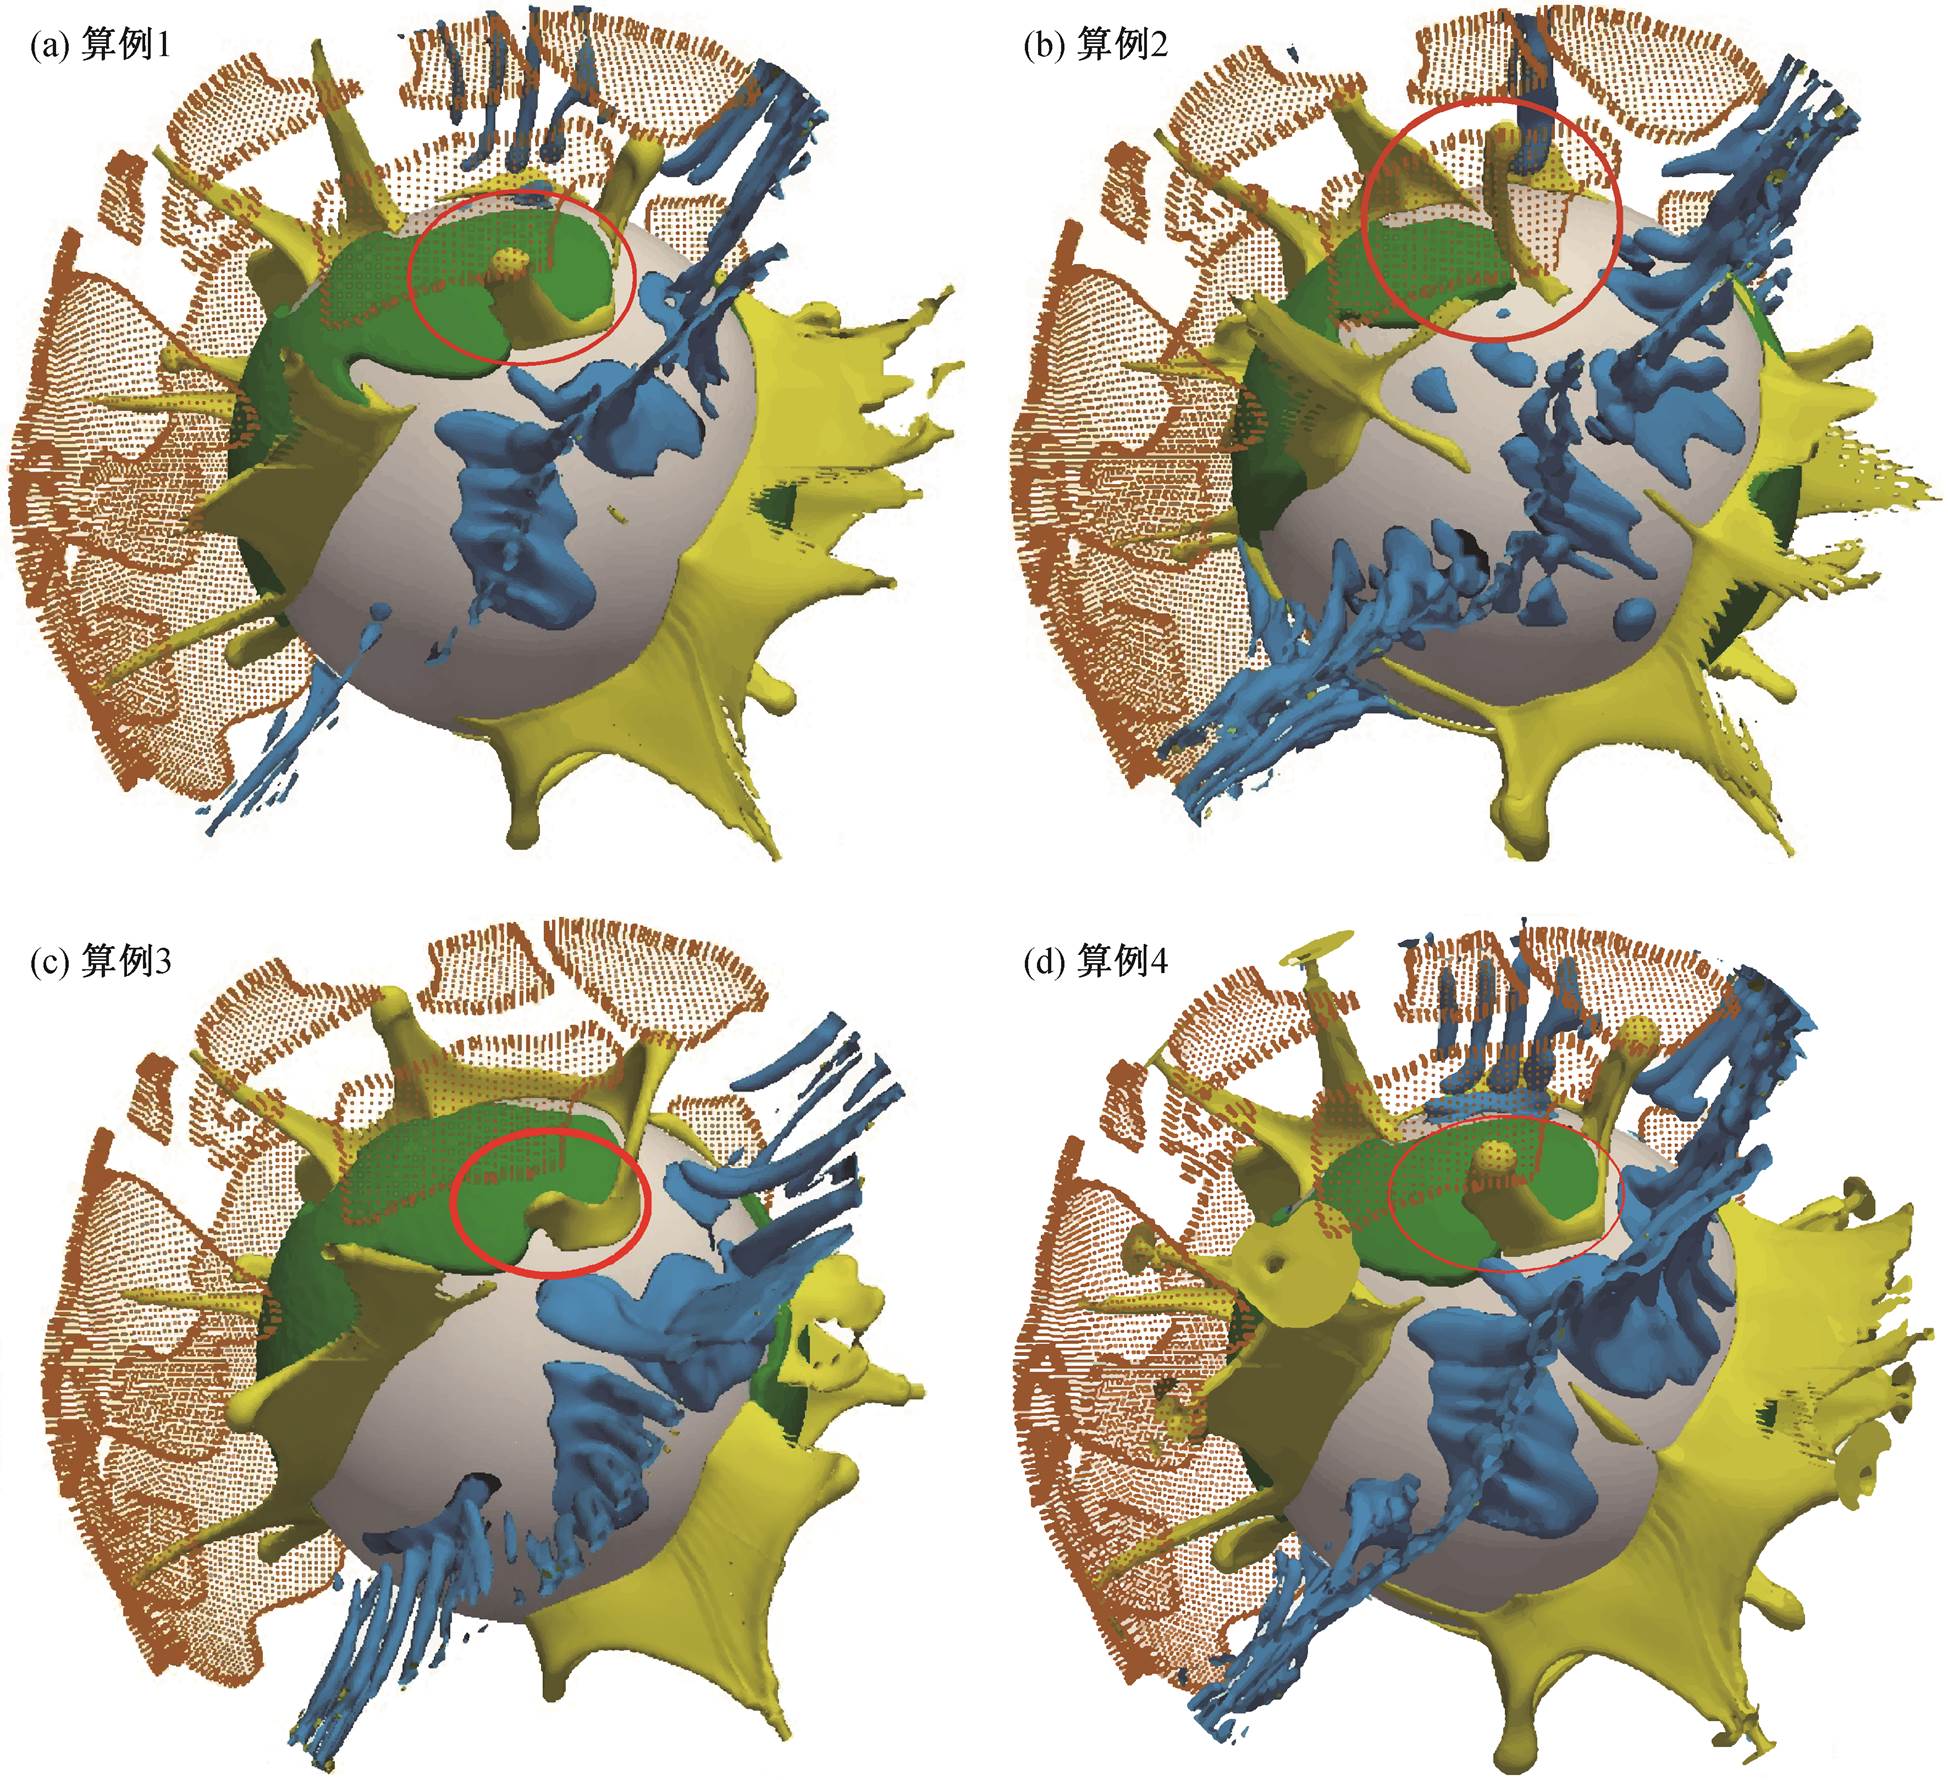
黄色代表地幔热柱(温度比同深度平均地幔温度高约 300K), 蓝色代表俯冲带(温度比同深度地幔温度低约300K)、绿色代表核幔边界处的 LLSVPs, 棕色代表地表的克拉通
图4 模型结果
Fig. 4 Model result
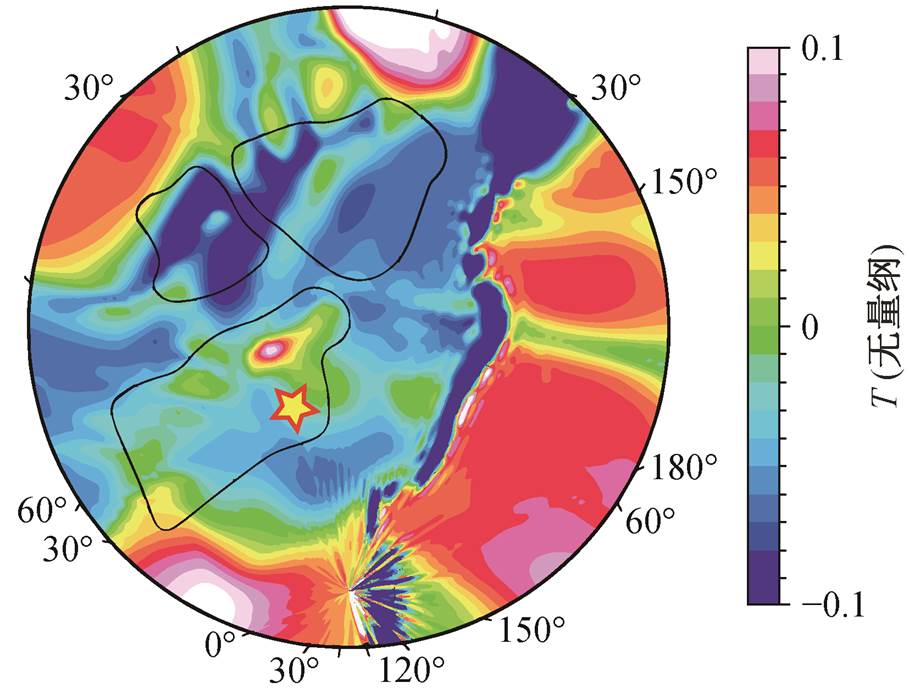
星号代表古地理重建的Ferrar大火成岩省喷发中心
图5 距地表 200 km 处的平面温度
Fig. 5 Temperature map at 200 km
三维全球模型与重建俯冲历史有关, 俯冲带的位置不同, 会在一定程度上导致热柱产生位置的差异。算例 3 与算例 1 的区别在于, 环超大陆俯冲带, 尤其是澳大利亚和南极洲东南侧的俯冲带, 向远离大陆岩石圈的方向移动, 使俯冲带与 LLSVPs 边缘的距离变大。算例 3 的结果(图 4(c))显示, 虽然成功地产生 Ferrar 热柱, 但其位置相对于算例 1 有一定程度的偏移, 地幔柱发生的位置与 LLSVPs 的边缘有一定的距离, 说明俯冲带位置对地幔柱的发生也有重要影响, 与 Li 等[38]的研究结果一致。事实上, 下地幔结构受地球表面板块构造演化(特别是俯冲带的演化)影响巨大, 核幔边界地幔柱的生成与热边界层的热不稳定性相关。只有当俯冲带位置与热柱产生位置的距离达到临界状态, 热边界层的厚度大到足以使其失稳时, 地幔柱才能生成。
此外, 我们也验证了俯冲带的其他物理性质, 例如黏度(表 2)。算例 4 (图 4(d))与算例 1 的区别在于软弱带的黏度减半, 模型中无量纲化的黏度 ηC从0.01 降至 0.005。算例 4 与算例 1 的结果对比显示, 地表环超大陆的软弱带黏度越小, 俯冲带的俯冲越强烈, 地幔对流速度越快, 产生 Ferrar 地幔柱的时间(约为 185Ma)也越早。同时, 俯冲带的强度与地幔柱的强度相关, 算例 4 中地幔柱的产生更强。然而, 地幔柱产生的位置并未改变, 说明软弱带黏度并不影响地幔柱产生位置。
本文运用数值模拟方法, 模拟 180Ma 前喷发的 Ferrar 大火成岩省中地幔柱的产生, 并讨论影响热柱产生及其喷发位置的关键因素, 结论如下。
1)地幔柱的位置受 LLSVPs 形状影响, 多发生在 LLSVPs 边缘曲率较大的位置。
2)俯冲带的位置对地幔柱的产生也有影响, 俯冲带到达核幔边界的位置与 LLSVPs 边缘的距离在一定程度上决定地幔柱位置相对于 LLSVPs 边缘的偏移量。
参考文献
[1] Li Z X, Zhong S. Supercontinent–superplume coup-ling, true polar wander and plume mobility: plate dominance in whole-mantle tectonics. Physics of the Earth and Planetary interiors, 2009, 176(3/4): 143‒ 156
[2] Morgan W J. Convection plumes in the lower mantle. Nature, 1971, 230: 42‒43
[3] Griffiths R W, Campbell I H. Stirring and structure in mantle starting plumes. Earth and Planetary Science Letters, 1990, 99(1/2): 66‒78
[4] Morgan W J. Hotspot tracks and the opening of the Atlantic and Indian Oceans. The Oceanic Lithosphere, 1981, 7: 443‒487
[5] Duncan R A, Richards M A. Hotspots, mantle plumes, flood basalts, and true polar wander. Reviews of Geo-physics, 1991, 29(1): 31‒50
[6] Hill R I, Campbell I H, Davies G F, et al. Mantle plumes and continental tectonics. Science, 1992, 256: 186‒193
[7] Zhang N, Dang Z, Huang C, et al. The dominant driv-ing force for supercontinent breakup: plume push or subduction retreat?. Geoscience Frontiers, 2018, 9(4): 997‒1007
[8] Dang Z, Zhang N, Li Z X, at al. Weak orogenic lithosphere guides the pattern of plume-triggered supercontinent break-up. Communications Earth and Environment, 2020, 1(1): 1‒11
[9] Anderson D L. Hotspots, polar wander, Mesozoic con-vection and the geoid. Nature, 1982, 297: 391‒393
[10] Hager B H, Clayton R W, Richards M A, et al. Lower mantle heterogeneity, dynamic topography and the geoid. Nature, 1985, 313: 541‒545
[11] Weinstein S A, Olson P L. The proximity of hotspots to convergent and divergent plate boundaries. Geo-physical Research Letters, 1989, 16(5): 433‒436
[12] Romanowicz B, Gung Y. Superplumes from the core-mantle boundary to the lithosphere: implications for heat flux. Science, 2002, 296: 513‒516
[13] Courtillot V, Davaille A, Besse J, et al. Three distinct types of hotspots in the earth’s mantle. Earth and Planetary Science Letters, 2003, 205(3/4): 295‒308
[14] Burke K, Torsvik T H. Derivation of large igneous provinces of the past 200 million years from long-term heterogeneities in the deep mantle. Earth and Planetary Science Letters, 2004, 227(3/4): 531‒538
[15] Burke K, Steinberger B, Torsvik T H, et al. Plume generation zones at the margins of large low shear velocity provinces on the core-mantle boundary. Earth and Planetary Science Letters, 2008, 265(1/2): 49‒60
[16] Torsvik T H, Smethurst M A, Burke K, et al. Large igneous provinces generated from the margins of the large low-velocity provinces in the deep mantle. Geo-physical Journal International, 2006, 167(3): 1447‒ 1460
[17] Zhong S, Zhang N, Li Z X, et al. Supercontinent cycles, true polar wander, and very long-wavelength mantle convection. Earth and Planetary Science Let-ters, 2007, 261(3/4): 551‒564
[18] Coltice N, Phillips B R, Bertrand H, et al. Global warming of the mantle at the origin of flood basalts over supercontinents. Geology, 2007, 35(5): 391‒394
[19] Collins W J. Slab pull, mantle convection, and Pan-gaean assembly and dispersal. Earth and Planetary Science Letters, 2003, 205(3/4): 225‒237
[20] Wilson R W, Houseman G A, McCaffrey K J, et al. Fifty years of the Wilson cycle concept in plate tecto-nics. Geological Society of London, 2019, 470: 87‒ 103
[21] Ernst R E, Bleeker W, Söderlund U, et al. Large Ig-neous Provinces and supercontinents: toward comple-ting the plate tectonic revolution. Lithos, 2013, 174: 1‒14
[22] Buiter S J H, Torsvik T H. A review of wilson cycle plate margins: a role for mantle plumes in continental break-up along sutures?. Gondwana Research, 2014, 26(2): 627‒653
[23] Seton M, Müller R D, Zahirovic S, et al. Global continental and ocean basin reconstructions since 200 Ma. Earth-Science Reviews, 2012, 113(3/4): 212‒270
[24] Müller R D, Seton M, Zahirovic S, et al. Ocean basin evolution and global-scale plate reorganization events since Pangea breakup. Annual Review of Earth and Planetary Sciences, 2016, 44: 107‒138
[25] Zhong S, Zuber M T. Long-wavelength topographic relaxation for self-gravitating planets and implica-tions for the time-dependent compensation of surface topography. Journal of Geophysical Research: Planets, 2000, 105(E2): 4153‒4164
[26] McNamara A K, Zhong S. Thermochemical structures within a spherical mantle: Superplumes or piles?. Journal of Geophysical Research: Solid Earth, 2004, 109: B07402
[27] Leng W, Zhong S. More constraints on internal hea-ting rate of the Earth’s mantle from plume observa-tions. Geophysical research letters, 2009, 36: L02306
[28] Zhang N, Zhong S, Leng W, et al. A model for the evolution of the Earth’s mantle structure since the Early Paleozoic. Journal of Geophysical Research: Solid Earth, 2010, 115: B06401
[29] Solomatov V S. Scaling of temperature- and stress-dependent viscosity convection. Physics of Fluids, 1995, 7(2): 266‒274
[30] Yoshida M, Santosh M. Voyage of the indian subcon-tinent since Pangea breakup and driving force of su-percontinent cycles: insights on dynamics from nu-merical modeling. Geoscience Frontiers, 2018, 9(5): 1279‒1292
[31] Tackley P J, King S D. Testing the tracer ratio method for modeling active compositional fields in mantle convection simulations. Geochemistry, Geophysics, Geosystems, 2003, 4: 8302
[32] Huang C, Zhang N, Li Z X, et al. Modeling the inception of supercontinent breakup: stress state and the importance of orogens. Geochemistry, Geophy-sics, Geosystems, 2019, 20(11): 4830‒4848
[33] Rolf T, Tackley P J. Focussing of stress by continents in 3D spherical mantle convection with self-consis-tent plate tectonics. Geophysical Research Letters, 2011, 38: L18301
[34] Young A, Flament N, Maloney K, et al. Global kine-matics of tectonic plates and subduction zones since the late Paleozoic Era. Geoscience Frontiers, 2019, 10 (3): 989‒1013
[35] Matthews K J, Maloney K T, Zahirovic S, et al. Glo-bal plate boundary evolution and kinematics since the late Paleozoic. Global and Planetary Change, 2016, 146: 226‒250
[36] Ritsema J, van Heijst H J, Woodhouse J H. Complex shear wave velocity structure imaged beneath Africa and Iceland. Science, 1999, 286: 1925‒1928
[37] Torsvik T H, Smethurst M A, Burke K, et al. Long term stability in deep mantle structure: evidence from the ~300 Ma Skagerrak-Centered Large Igneous Pro-vince (the SCLIP). Earth and Planetary Science Let-ters, 2008, 267(3/4): 444‒452
[38] Li M, Black B, Zhong S, et al. Quantifying melt production and degassing rate at mid-ocean ridges from global mantle convection models with plate motion history. Geochemistry, Geophysics, Geosyst-ems, 2016, 17(7): 2884‒2904
Study on the Mechanism of Mantle Plume Production:Taking Ferrar as an Example
Abstract According to the mantle convection control equations, taking the Ferrar large igneous province (LIP) erupted at 180 Ma as an example, we used the 3D numerical simulation method and introduced Pangea supercontinent, large low shear velocity provinces (LLSVPs), subductions surrounding Pangea supercontinent to simulate mantle convection process.The evolution process of Ferrar LIP from the interior thermal boundary layer of the earth (such as the core-mantle boundary) and the related factors affecting the location of mantle plumes are discussed. The results show that the shape of LLSVPs and the distance between subduction zone and LLSVPs’ edge have great influence on the location of mantle plumes. The mantle plumes often rise from the position where the curvature of the LLSVPs’ edge is large, and gradually shift away from the LLSVPs’ edge with the increase of the distance between the subduction zone and the LLSVPs’ edge. The viscosity of the subduction zone affects the timing of the mantle plume emergence, but not the location of the mantle plume production.
Key words 3-D numerical simulation; mantle plume; Ferrar LIP; subduction; LLSVPs
doi: 10.13209/j.0479-8023.2022.018
国家自然科学基金(NSFC4197060753)资助
收稿日期: 2021-03-22;
修回日期: 2021-05-12