约占北半球陆地面积 1/4 的多年冻土区主要分布在北半球中高纬度地区[1], 在全球平均气温呈波动上升趋势的背景下, 多年冻土区的升温幅度更大,升温速率是其他地区的两倍[2-3], 对气候变化的响应十分敏感[4-5]。全球已有多地观测到多年冻土面积缩减和冻土活动层加深的现象[6-10], 多年冻土的边界也明显北移[11]。
一般认为, 气候变暖会促进高纬度地区低温限制的植被生长, 三十多年来高纬度地区植被活动增强的事实也证实了这一观点[12-14]。有研究指出, 北半球高纬度地区升温对植被生长的影响是非线性的, 升温对植被生长的促进作用随温度升高而逐渐减弱[15-17], 部分地区植被生长衰退甚至死亡, 可能与冻土活动的变化有关[18-24]。随着升温趋势进一步持续, 气候变化如何影响北半球高纬度冻土分布区的植被生长尚不明确。
中国高纬度多年冻土主要分布在东北地区北部[2], 属北半球中高纬多年冻土区的南缘。研究表明, 受气候变暖的影响, 中国东北地区的冻土正在逐渐退化[25-29]。本文基于遥感归一化植被指数(NDVI), 探讨中国东北多年冻土区的植被变化趋势及其对气候变化的响应, 试图为预测未来气候变化下这一地区植被生长的变化趋势提供依据。
1 研究区与研究方法
1.1 研究区概况
中国东北多年冻土区位于欧亚大陆高纬度多年冻土分布带东南缘, 其发育主要受气候因素控制。随着纬度增加, 多年冻土破碎化程度逐渐增加。根据第二代环极地冻土及地下冰数据库资料[30], 该区冻土自北向南可以分为连续多年冻土(多年冻土连续性为 90%~100%)、岛状多年冻土(多年冻土连续性为 50%~90%)、稀疏多年冻土(多年冻土连续性为10%-50%)和非多年冻土/季节冻土(多年冻土连续性<10%)4 类。
中国东北多年冻土区是我国重要的原始林区之一, 植被类型丰富[25-26]。其中, 连续多年冻土区有大片针叶林分布, 优势树种为兴安落叶松(Larix gmelinii); 岛状多年冻土区除针叶林外, 也有草原分布; 稀疏多年冻土区和非多年冻土区分布着针叶林、草原和针阔混交林, 混交林中的阔叶树种以白桦(Betula platyphylla)和蒙古栎(Quercus mongolica)居多。根据冻土破碎化梯度和植被分类, 本研究将东北多年冻土分布区分为 9 个子区域进行研究(图 1(a))。
研究区地属寒温带大陆性季风气候, 过去 40年来温度呈现波动上升的趋势[31]; 降水波动变化不大, 近年来年降水量有增加趋势(图 1(b)和(c), 站点气温数据来自中国气象数据网http://data.cma.cn/)。
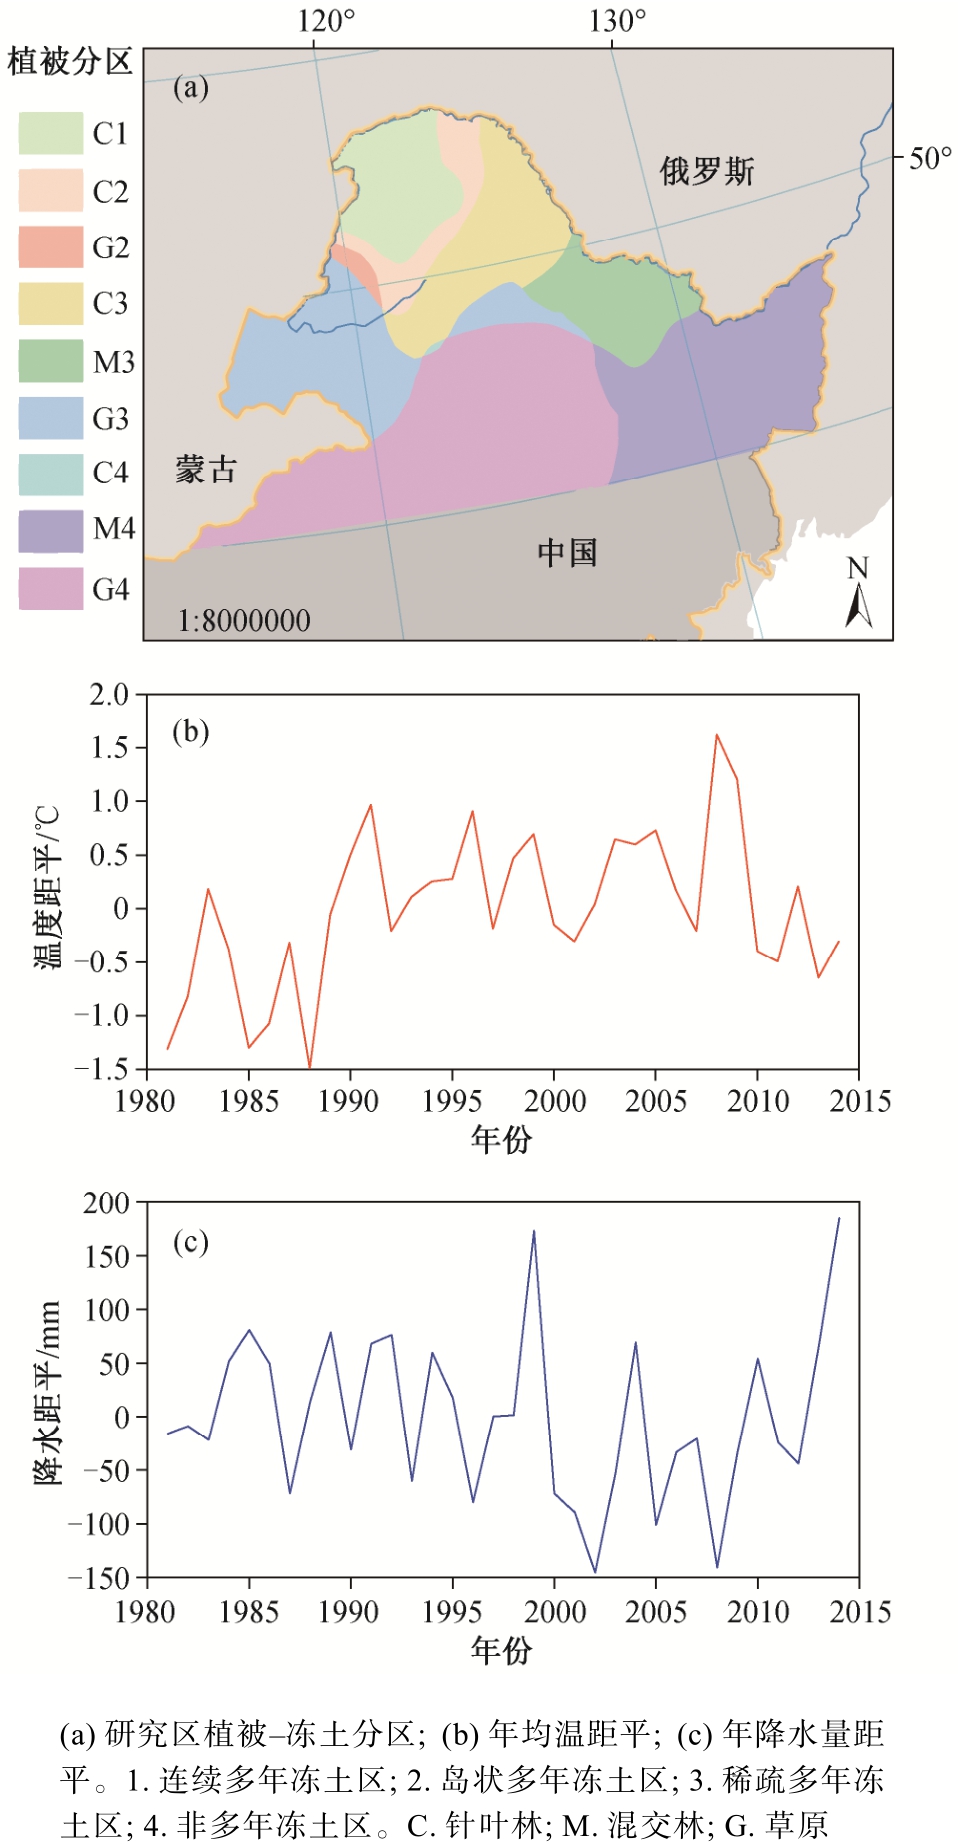
图1 研究区植被区划与气候特征
Fig. 1 Vegetation zones and climate features in the study area
随着气温的升高, 冻土地区的年平均地温也呈现上升趋势[32], 导致多年冻土区的冻土在一定程度上退化, 活动层加深, 冻土面积缩减。沿着不同的冻土破碎化梯度, 气候变化对植被的影响可能出现差异[33]。
1.2 数据来源
植被指数是利用植物细胞中叶绿素对红光和近红外吸收反射的不同, 通过波段组合表达植被信息的遥感指数。归一化植被指数(normalized difference vegetation index, NDVI)指示植被覆盖和植被生长[27],计算方式如下:
其中, NIR 为近红外波段的反射值, R 为红光波段的反射值。NDVI 值介于-1 ~ 1 之间, 数值越大表示植被覆盖度越高。本研究采用的生长季 NDVI 数据来自 GIMMIS 工作组的 NOAA AVHRR 第三代数据,时间跨度为 1982—2014 年, 时间分辨率为 15 天,空间分辨率为 0.083° [28]。该数据集校正了传感器改变和太阳高度角的影响, 广泛应用于植被生长相关研究中[29,34-35]。
气象数据来自中国气象数据网(http://data.cma.cn/)发布的《中国地面气候资料年值数据集》, 选用东北多年冻土区 30 个气象台站 1982—2014 年的月平均温度和月降水量的地面观测数据。
植被类型数据来自《1:1000000 中国植被图集》[36]。
1.3 研究方法
采用最大值合成法(maximum value composite),将原始 NDVI 数据合并为月数据的最大值, 进一步消除大气和云量的干扰[37]。生长季 NDVI 由 4—10月的NDVI 值累加得到。
根据气象观测站点的观测数据, 对站点气象数据进行 IDM 插值处理, 得到研究区域不同年份的月均温和月降水量数据, 获取与 NDVI 数据分辨率一致的气候要素图。计算研究区内 NDVI 序列与生长季均温和降水量序列的相关系数。
2 结果
2.1 NDVI 变化趋势
在中国东北多年冻土区, 基于 10 年滑动平均的NDVI 年际变化率具有明显的空间分布格局。沿着冻土破碎化梯度, 分析 3 种典型植被类型(针叶林、混交林和草原)的 NDVI 年际变化趋势, 结果见图 2。
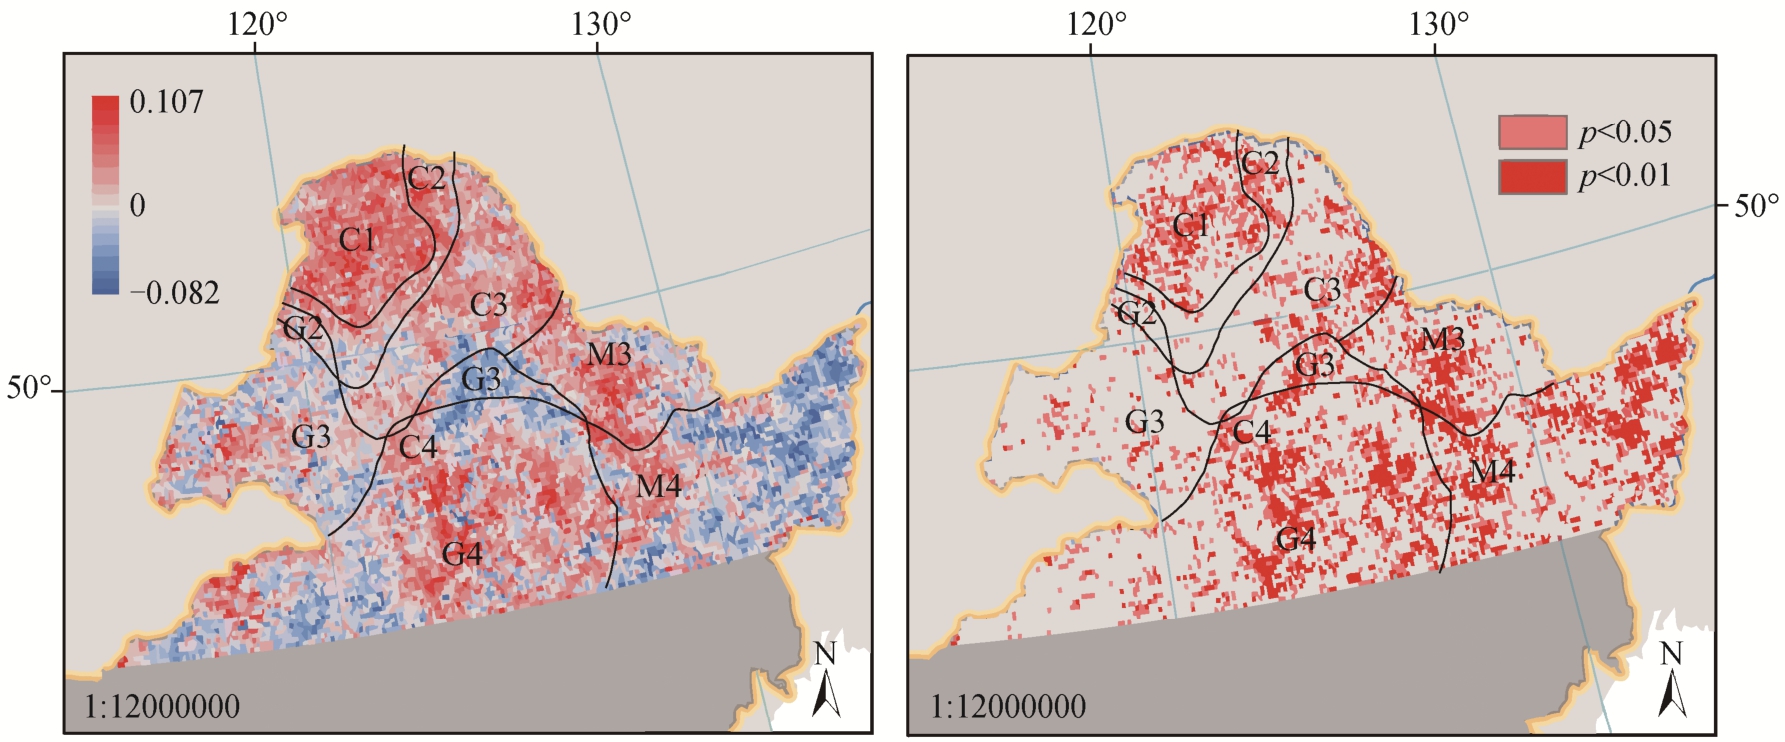
图2 NDVI 年际变化率(a)及显著性水平(b)
Fig. 2 Interannual change rate (a) and significance level (b) of NDVI
针叶林在不同冻土分区(C1~C4)均显示增加趋势, 且集中生长在多年冻土区, 仅有极少部分分布在非多年冻土区。混交林的 NDVI 在稀疏多年冻土区(M3)呈现增加趋势, 在非多年冻土区(M4)呈现递减趋势。草原 NDVI 的变化趋势与混交林相反, 沿着冻土破碎化梯度(G2~G4), NDVI 由下降趋势转为增加趋势。
研究区像元的变化情况见图 3, 可以看出, 1982—2015 年, 中国东北多年冻土区 NDVI 有 63.57%的像元呈增加趋势, 36.40%的像元呈减小趋势。其中,针叶林在连续多年冻土区(C1)增加比例最高, 有96.94%的区域均显示 NDVI 增加。非多年冻土区针叶林(C4)区域面积较小, 不纳入比较分析; 混交林在非多年冻土区(M4) NDVI 下降的比例最高, 达到61.77%, 出现明显衰退; 草原在非多年冻土区(G4)活动增强(图 3)。
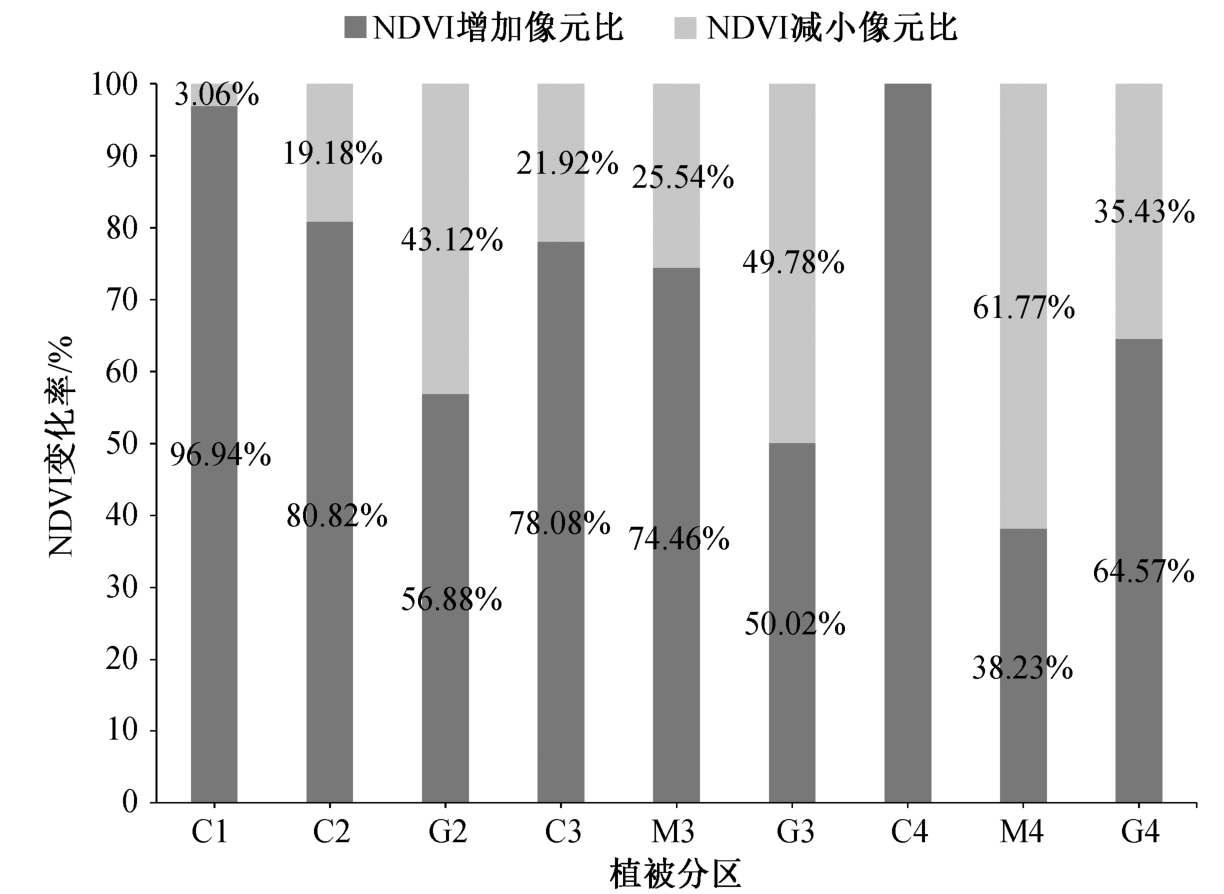
图3 不同分区生长季NDVI 像元变化率
Fig. 3 Change ratio of pixels in different zones of NDVI during growing season
进一步提取 NDVI 出现显著变化的像元, 比较不同分区生长季的 NDVI 年际变化率均值, 结果如图 4 所示。可以看出, 针叶林的增长速度明显高于其他植被类型。随着冻土破碎化程度增加, 针叶林的增长速度从每 10 年增长 0.016 减小到 0.010, 混交林由每 10 年增长 0.011 到减少 0.006, 增速逐渐降低(忽略面积较小的非冻土区针叶林)。草原在非多年冻土区出现明显增加趋势(0.008/每 10 年), 增速大于岛状多年冻土区(0.006/每 10 年)。草原在稀疏多年冻土区出现明显衰退(-0.003/每 10 年), 衰退速度小于非多年冻土区的混交林(-0.006/每 10 年)。
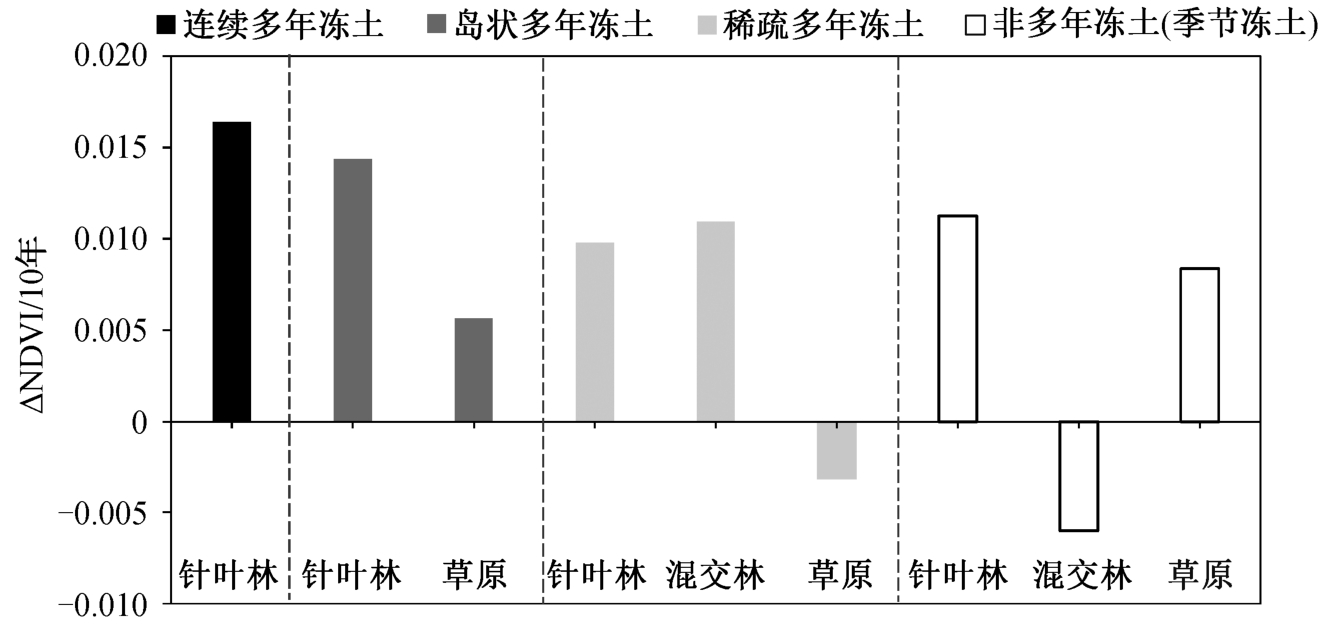
图4 不同分区生长季NDVI 年际变化率均值
Fig. 4 NDVI mean interannual change rate in growing season of different zones
2.2 NDVI 对气候变化的响应
2.2.1 对温度变化的响应
中国东北多年冻土分布区植被 NDVI 与生长季温度的相关性分析结果(图 5)显示, 在不同冻土退化梯度上, 针叶林(C1~C4) NDVI 均对生长季温度表现出正响应; 多年冻土区混交林(M3)与温度正相关, 而在非多年冻土区(M4)负相关; 草原在多年冻土区(G2~G3)对温度响应不敏感, 在非冻土区(G4)的响应较为复杂。总体上, 多年冻土区针叶林和混交林受温度限制, 非多年冻土区混交林和草原与温度呈现显著相关像元的比例较小。
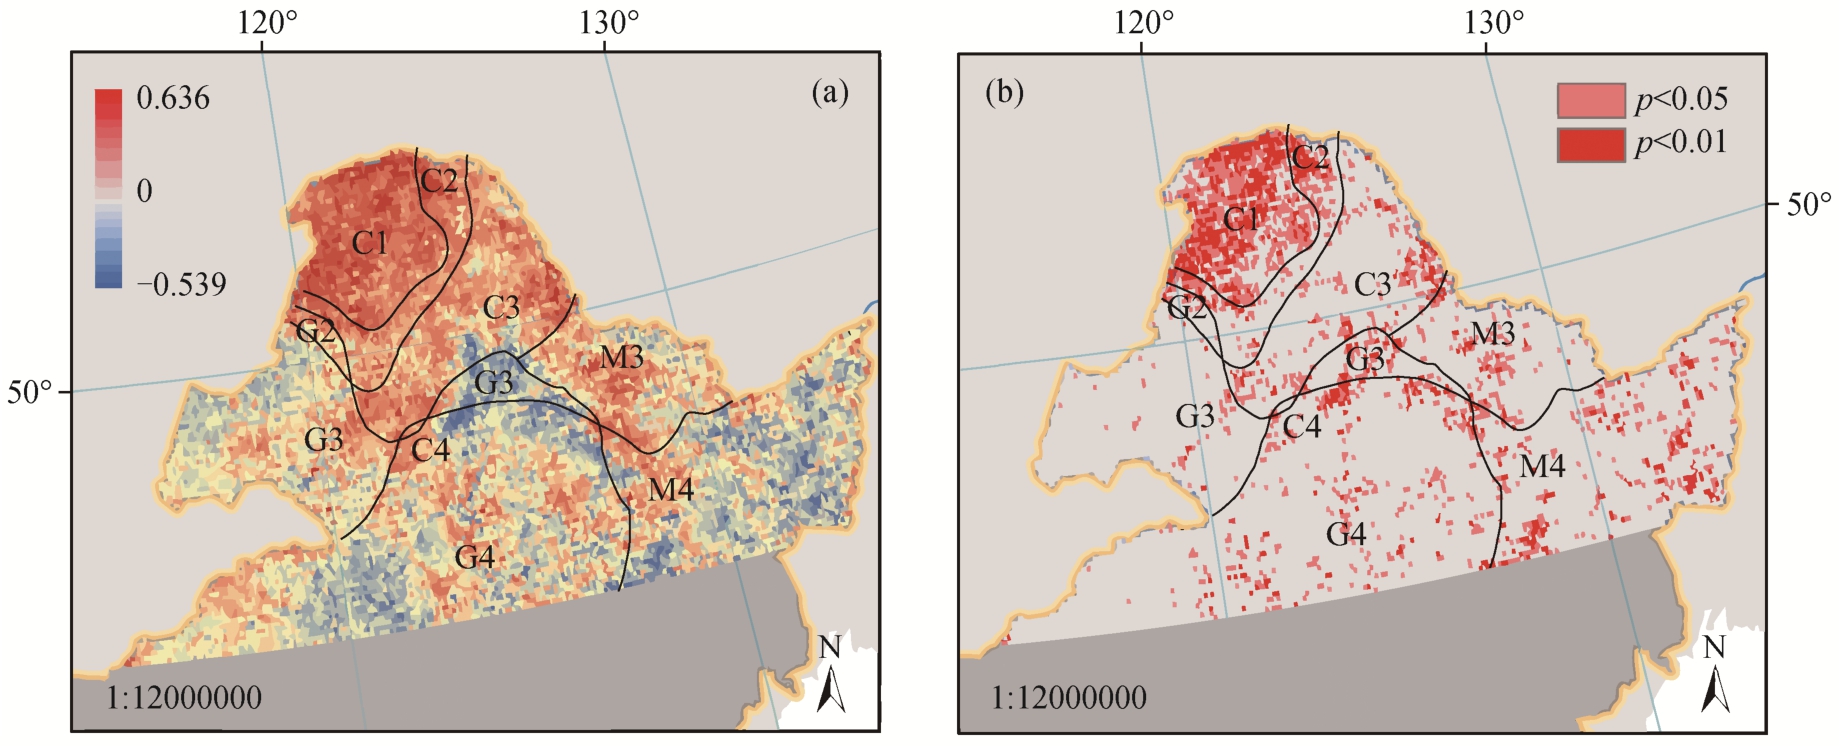
图5 NDVI 与生长季温度的相关性(a)及显著性(b)
Fig. 5 Correlation coefficient (a) and significance level (b) of NDVI and growing season temperature
2.2.2 对降水变化的响应
研究区植被 NDVI 与生长季降水的相关性分析结果(图 6)显示, 自北向南随冻土破碎化加剧和冻土活动层厚度加深, 针叶林(C1~C4)的 NDVI 与生长季降水量存在负相关关系; 草原在稀疏多年冻土区(G3)和非多年冻土区(G4)与降水存在显著的正相关关系。混交林与生长季降水的关系从多年冻土区(M3)的负相关变为非多年冻土区(M4)的正相关。
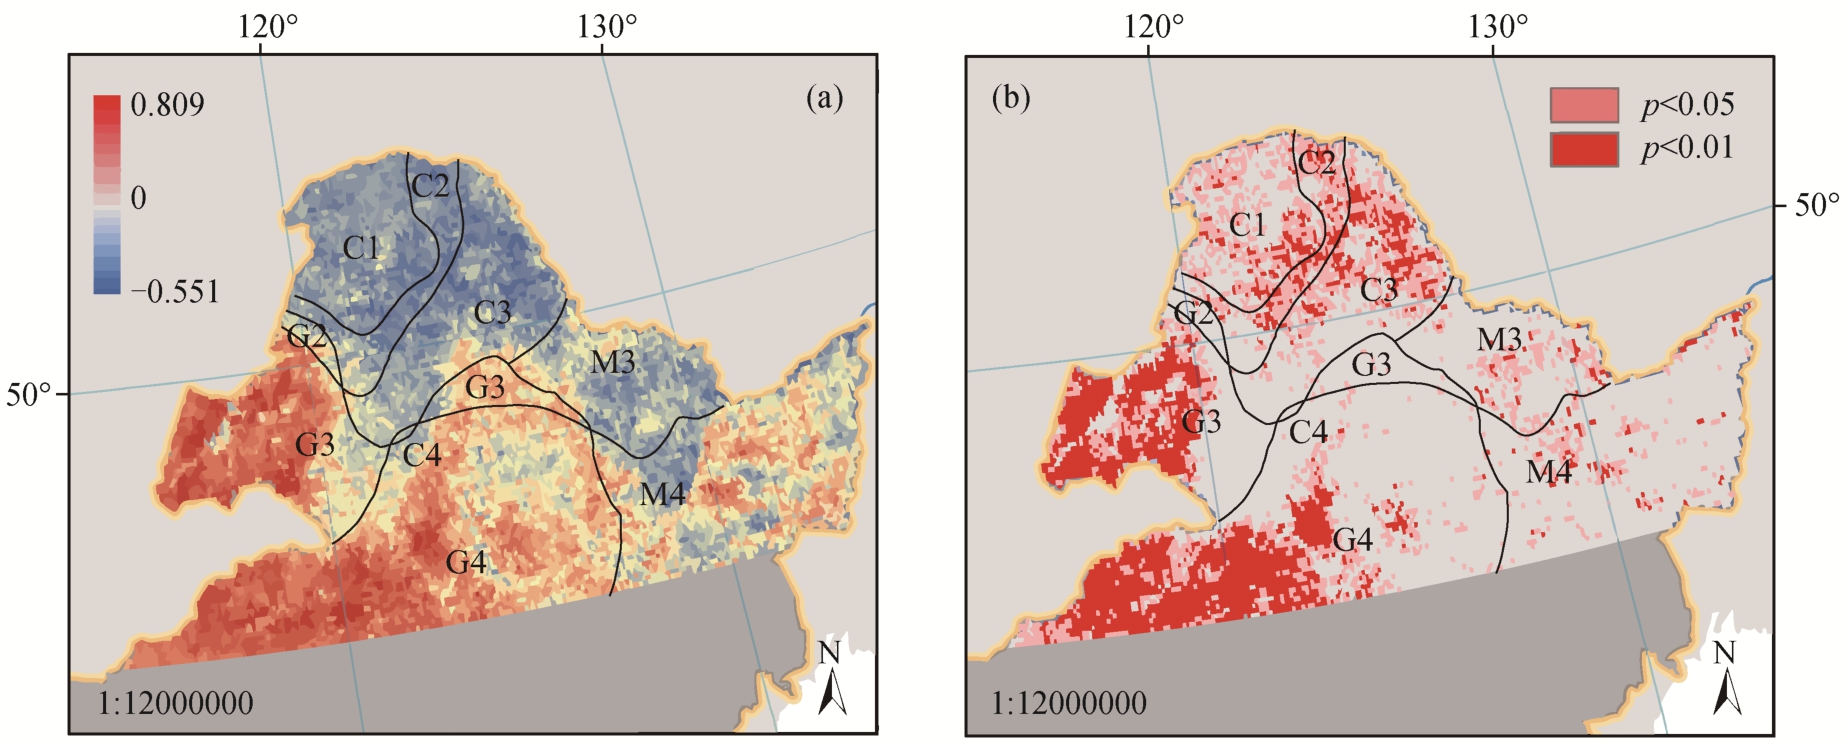
图6 NDVI 与生长季降水量的相关性(a)及显著性(b)
Fig. 6 Correlation coefficient (a) and significance level (b) of NDVI and growing season precipitation
3 讨论和结论
本文研究结果表明, 中国东北地区多年冻土分布区 NDVI 有 63.57%的区域增加, 36.40%的区域减少, 总体上冻土区植被活动增强。NDVI 显著增加的区域集中在连续多年冻土区针叶林和非多年冻土区草原。混交林的 NDVI 在非多年冻土区显著减少,在多年冻土区则显著增加。由于冻土这一特殊生境的作用, 长期的冻融循环也会受到持续升温的影响,对树木的生长和土壤的理化性质产生不可逆转的改变[38-40]。混交林的迁移可能与树种对水热条件的适应性有关[41-44]。
中国东北地区针叶林在不同冻土退化程度下对气候变化的响应表现出一致性, 与生长季温度正相关, 与生长季降水负相关。我们认为这与全球变暖背景下快速升温导致的多年冻土加速融化有关。一方面, 由于随温度升高, 高纬度地区的低温限制逐渐解除, 为树木生长提供了良好的生长条件; 另一方面, 多年冻土层是不透水层, 降水与冻土融水在浅层地表下方和冰层上方蓄积, 降水对植被生长的负作用可能与水分浸泡现象有关[45]。针叶林的主要组成树种大多为浅根系, 当降水量较大时, 很可能导致植被根系被淹没, 根系进行无氧呼吸, 从而对植物生长产生不利影响。
混交林在多年冻土区与非多年冻土区对气候的响应出现明显的差异, 对生长季温度由正相关变为负相关, 对降水从负相关变为正相关, 可能与冻土活动层深度差异导致的不同水分供给条件有关。俄罗斯冻土监测研究结果显示, 1997 年以来, 随着冻土活动层深度增加, NDVI 与气温的偏相关系数下降[46], 也进一步佐证冻土是影响森林生长响应气候变化的重要因素。草原 NDVI 对气候的响应情况与针叶林和混交林不同, 对温度不敏感, 而与降水显著正相关, 说明水分是草原植被的主要限制因子。
本文研究结果进一步说明, 冻土区气候变化对植被生长的影响不仅表现为气候条件的直接影响,冻土退化引起的活动层深度增加也和引起水分和热量的再分配, 从而影响植被生长[33]。
在未来更剧烈的升温情境下, 中国东北多年冻土区植被的空间异质性可能会更加明显。在气候-冻土耦合影响下, 多年冻土融化产生的多余水分对树木根系的浸淹风险会减弱, 针叶林和混交林会逐渐北移, 草原则可能更多地占据非多年冻土区。
[1] 李新, 程国栋. 冻土-气候关系模型评述. 冰川冻土, 2002, 24(3): 315-321
[2] IPCC. Climate change 2013: the physical science basis// Stocker T F, Qin D, Plattner G, et al. Contribution of working group I to the fifth assessment report of the intergovernmental panel on climate change of the intergovernmental panel on climate change. Cambridge, 2013: 710-719
[3] IPCC. Climate change 2007: the physical science basis // Solomon S D, Qin M, Manning Z, et al.Contribution of working group I to the fourth assessment report of the intergovernmental panel on climate change. Cambridge, 2007: 1-56
[4] Woo M, Lewkowicz A G, Rouse W R. Response of the Canadian permafrost environment to climatic change.Early Human Development, 1992, 86(3): 167-170
[5] Camill P, Clark J S. Long-term perspectives on lagged ecosystem responses to climate change: permafrost in boreal peatlands and the grassland/woodland boundary. Ecosystems, 2000, 3(6): 534-544
[6] IPCC. Climate change: the physical science basis.Contribution of Working, 2013, 43(22): 866-871
[7] Zimov S, Schuur E A, Chapin F S, et al. Permafrost and the global carbon budget. Science, 2006, 312:1612-1613
[8] Jorgenson M T, Racine C H, Walters J C, et al. Permafrost degradation and ecological changes associated with a warming climate in central Alaska. Climatic Change, 2001, 48(4): 551-579
[9] Jorgenson M T, Shur Y L, Pullman E R. Abrupt increase in permafrost degradation in Artic Alaska.Geophysical Research Letters, 2006, 33: L02503
[10] Xue X, Guo J, Han B S, et al. The effect of climate warming and permafrost thaw on desertification in the Qinghai-Tibetan Plateau. Geomorphology, 2009, 108:182-190
[11] Yang M X, Nelson F E, Shiklomanov N I, et al.Permafrost degradation and its environmental effects on the Tibetan Plateau: a review of recent research.Earth-Science Reviews, 2010, 103(1/2): 31-44
[12] Lawrence D M, Slater A G. A projection of severe near-surface permafrost degradation during the 21st century. Geophysical Research Letters, 2005, 32(24):L24401
[13] Pan Y, Birdsey R A, Fang J, et al. A large and persistent carbon sink in the world's forests. Science, 2011,333: 988-993
[14] Lucht W, Prentice I C, Myneni R B, et al. Climatic control of the high-latitude vegetation greening trend and Pinatubo effect. Science, 2002, 296: 1687-1689
[15] Bogaert J, Zhou L, Tucker C J, et al. Evidence for a persistent and extensive greening trend in Eurasia inferred from satellite vegetation index data. Journal of Geophysical Research, 2002, 107: D11
[16] Trenberth K E, Fasullo J T, Branstator G, et al. Seasonal aspect of the recent pause in surface warming.Nature Climate Change, 2014, 4(10): 911-916
[17] Wu X, Liu H, Li X, et al. Higher temperature variability reduces temperature sensitivity of vegetation growth in northern hemisphere. Geophysical Research Letters, 2017, 44(12): 6173-6181
[18] Barber V A, Juday G P, Finney B P. Reduced growth of Alaskan white spruce in the twentieth century from temperature-induced drought stress. Nature, 2000,405: 668-673
[19] Wilmking M, Juday G, Barber V A, et al. Recent climate warming forces contrasting growth responses of white spruce at treeline in Alaska through temperature thresholds. Global Change Biology, 2004, 10(10):1-13
[20] Andreu L, Gutiérrez E, Macias M, et al. Climate increases regional tree-growth variability in Iberian pine forests. Global Change Biology, 2007, 13(4):804-815
[21] Littell J S, Peterson D L, Tjoelker M. Douglas-fir growth in mountain ecosystems: water limits tree growth from stand to region. Ecological Monographs,2008, 78(3): 349-368
[22] Klos R J, Wang G G, Bauerle W L, et al. Drought impact on forest growth and mortality in the southeast USA: an analysis using Forest Health and Monitoring data. Ecological Applications, 2009, 19(3): 699-708
[23] Allen C D, Macalady A K, Chenchouni H, et al. A global overview of drought and heat-induced tree mortality reveals emerging climate change risks for forests. Forest Ecology and Management, 2010, 259(4): 660-684
[24] Dulamsuren C, Hauck M, Leuschner C. Recent drought stress leads to growth reductions in Larix siberica in the western Khentey, Mongolia. Global Change Biology, 2010, 16(11): 3024-3035
[25] Jin H, Li S, Cheng G, et al. Permafrost and climatic change in China. Global and Planetary Change, 2000,26(4): 387-404
[26] Chang X L, Jin H J, He R X, et al. Advances in permafrost and cold regions environments studies in the Da Xing’anling (Da Hinggan) Mountains, Northeastern China. Journal of Glaciology and Geocryology, 2008, 30(1): 176-182
[27] Myneni R B, et al. The interpretation of spectral vegetation indexes. IEEE Transactions on Geoscience and Remote Sensing, 1995, 33(2): 481-486
[28] Pinzon J E and Tucker C J. A non-stationary 1981-2012 AVHRR NDVI 3g time series. Remote Sensing,2014, 6(8): 6929-6960
[29] Holben B N. Characteristics of maximum value composite images for temporal AVHRR data. International Journal of Remote Sensing, 1986, 7(11): 1417-1437
[30] Brown J, Ferrians O, Heginbottom J A, et al. Circum-Arctic map of permafrost and ground-ice conditions.Version 2. Boulder, Colorado: National Snow and Ice Data Center. 2002
[31] 姜晓艳, 刘树华, 马明敏, 等. 中国东北地区近百年气温序列的小波分析. 气候变化研究进展, 2008,4(2): 122-125
[32] 魏智, 金会军, 张建明, 等. 气候变化条件下东北地区多年冻土变化预测. 中国科学: 地球科学, 2011,41(1): 74-84
[33] 杨建平, 杨岁桥, 李曼, 等. 中国冻土对气候变化的脆弱性. 冰川冻土, 2013, 35(6): 86-95
[34] Zhou L M, Tucker C J, Kaufmann R K, et al. Variations in northern vegetation activity inferred from satellite data of vegetation index during 1981 to 1999.Journal of Geophysical Research, 2001, 106(17):20069-20083
[35] Piao S L, Wang X H, Ciais P, et al. Changes in satellite-derived vegetation growth trend in temperate boreal Eurasia from 1982 to 2006. Global Change Biology, 2011, 17(10): 3228-3239
[36] 中国科学院中国植被图编辑委员会. 中国植被图集.北京: 科学出版社, 2001
[37] Peng C, Ma Z, Lei X, et al. A drought-induced pervasive increase in tree mortality across Canada’s boreal forests. Nature Climate Change, 2011, 1(9):467-471
[38] Zhang J , Ge J P , Guo Q X. The relation between the change of NDVI of the main vegetational types and the climatic factors in the northeast of China. Acta Ecologica Sinica, 2001, 21(4): 522-527
[39] Keeling C D, Chin J F S, Whorf T P. Increased activity of northern vegetation inferred from atmospheric CO2 measurements. Nature, 1996, 382: 146-149
[40] Ding Y. Degradation of permafrost in china and the response to climatic warming. Proceedings of the Seventh International Conference Permafrost. Yellowknife, 1998, 57: 225-231
[41] 张新时. 研究全球变化的植被-气候分类系统. 第四纪研究, 1993, 13(2): 157-169
[42] Valentini R, Dore S, Marchi G, et al. Carbon and water exchanges of two contrasting central Siberia landscape types: regenerating forest and bog. Functional Ecology, 2004, 14(1): 87-96
[43] Arneth A, Kurbatova J, Kolle O, et al. Comparative ecosystem-atmosphere exchange of energy and mass in a European Russian and a central Siberian bog II.Interseasonal and interannual variability of CO2 fluxes. Tellus Series B ― Chemical and Physical Meteorology, 2002, 54(5): 514-530
[44] Kiselev M V, Dyukarev E A, Voropay N N. The temperature characteristics of biological active period of the peat soils of Bakchar swamp. IOP Conference Series Earth and Environmental Science, 2018, 107(1): 12-32
[45] Myneni R B, Keeling C D, Tucker C J, et al.Increased plant growth in the Northern high latitudes from 1981 to 1991. Nature, 1997, 386: 698-702
[46] Guo W, Liu H, Anenkhonov O A, et al. Vegetation can strongly regulate permafrost degradation at its southern edge through changing surface freeze-thaw processes. Agricultural and Forest Meteorology, 2018, 252:10-17