近年来, 随着沿江沿海城市人口的激增和工农业的快速发展, 工业“三废”和城市生活污水的排放,以及日益繁荣的江、海运带来的油垢溢漏, 大量污染物聚集在河口海湾地区, 对海洋生态系统造成严重的威胁[1-4]。一方面, 海洋及沿海湿地沉积物中的重金属元素会通过食物链的富集和放大作用, 在食物链传递中持续累积, 对人体造成危害[5-6]; 另一方面, 湿地中复杂的水文状况和理化条件极易使沉积下来的污染物重新进入生态系统, 进而造成二次污染[7]。重金属在沉积物中的含量通常比相应水体中高很多倍, 且其分布具有较明显的规律[8]。
深圳是我国过去 40 年快速城市化的典型城市,其重金属污染问题在我国沿海发达地区具有代表性[9-10]。对深圳海洋沉积物中重金属污染状况的研究开始于 20 世纪 90 年代。赵一阳等[11]探究广东沿海沉积物中重金属的分布规律, 提出著名的赵一阳粒径与元素含量的关系定律。唐得昊等[12]测定深圳湾 15 个表层沉积物中重金属 Zn, Cu, Pb, As,Cd 以及总有机碳的含量, 探讨重金属污染特征、重金属之间及其与 TOC 的相互关系, 并利用潜在生态风险评价法进行潜在生态风险评估。《深圳市 2017 年海洋环境状况公报》[13]显示, 2017 年深圳市海水总体状况延续东优西劣的历史特点, 劣四类海域面积占53.3%, 大、小梅沙海水浴场不适宜游泳的天数分别为 36%和 20%。2017 年全年发现赤潮1 起, 累计面积约为 45 km2; 重点海域珠江口和深圳湾污染严重。同时, 海洋沉积物理化特征适宜Hg, Cd, As, Cu, Zn, Pb 和 Cr 等重金属的迁移转化,可能进一步增加其生态风险[6,14-16]。在全球化背景下, Hg, Cd, As, Cu, Zn, Pb 和 Cr 等重金属作为全球性的污染物, 受到世界各国普遍关注。但是, 目前深圳市近海海域重金属污染种类及其空间分布情况尚不清楚。
本研究基于文献调研, 通过空间分析, 更加系统地阐明深圳近海水体和表层沉积物的重金属污染特征, 并对水体和沉积物的重金属生态风险进行评价, 以期为深圳近海环境保护和治理提供数据支持和决策依据。
1 材料与方法
1.1 数据来源
基于文献检索法, 以深圳近海(Shenzhen coastal areas)、海水(sea water)、沉积物(sediment)、重金属(heavy metals)和空间分布(spatial distribution)等为关键词, 在中国科学引文数据库、Web of Science核心合集、中华人民共和国自然资源部、深圳市海洋部及深圳市环境监测中心站进行检索, 共获得深圳近海海域重金属相关的有效文献 31 篇(包括中文文献 10 篇、英文文献 17 篇和相关科技报告 4 篇)。对文献数据进行筛选和总结, 得到采样时间在2007—2018 年期间的深圳市近岸海域(西部海域为珠江口和深圳湾等区域, 东部海域为大亚湾和大鹏湾等区域)水体(0~1 m)[17-22]和表层沉积物(0~10 cm)[1,23-32]的理化性质数据和重金属含量数据。海水水体的理化性质[13,17-22,32-37]包括石油类、pH、溶解氧(DO)、化学需氧量(COD)、活性磷酸盐、无机氮、盐度、浊度和总氮(TN), 沉积物的理化性质[1,28,35,38-43]包括 pH、盐度、电导率、总固体溶解度(TDS)、含水率(MC)、总有机碳(TOC%)、总碳(TC)、总氮(TN)、氨氮和总磷(TP)。在重金属污染方面, 筛选所有样点共有的重金属汞(Hg)、铜(Cu)、铅(Pb)和镉(Cd)作为海水污染的代表性重金属, 共 37 个有效样点; 筛选出镉(Cd)、铜(Cu)、锌(Zn)、铅(Pb)、铬(Cr)、汞(Hg)和砷(As)作为沉积物污染的代表性重金属, 共 54 个有效样点。
1.2 空间分析方法
空间插值技术基于距离越近的点相关性和相似度越高的原理[44], 将离散的测量数据转换成连续的数据曲面, 使用区域变量来估计和模拟空间格局,已广泛应用于水体[45-46]、土壤[44,47]和大气[48]等研究领域。常见的空间插值法包括克里金插值法、反距离权重法、自然邻域法、样条函数法和径向基函数法等[44,49]。其中, 克里金插值法是以变异函数理论和结构分析为基础, 通过已知样本点的赋权重求得未知点的值, 在有限区域内对区域化变量进行无偏估计的一种方法[50], 对于预测土壤重金属污染[44]、水体重金属污染[45]及富营养状态[46]等环境变量的空间分布格局有较高的精度。
本研究基于地理信息系统(geographic information system, GIS)平台, 运用克里金插值法, 对深圳近海水体和沉积物重金属数据进行空间插值分析,计算公式如下:
式中, Z(x0)为未知点的值, Z(xi)为未知点周围的已知样点的值, λ 为第 i 个已知样本点对未知点的权重, n为已知样本点的个数。
1.3 重金属污染评价和风险评价方法
1.3.1 重金属污染评价方法
采用《海水水质标准》(GB 3097—1997)中第一类海水的重金属含量限值作为评价标准, 使用WQI 污染指数法, 对海水中重金属的污染水平进行评价, 计算公式[51]如下:

1.3.2 重金属风险评价方法
本研究采用物种敏感性分布(species sensitivity distribution, SSD)方法评价海水中 Hg, Cu, Pb 和 Cd的生态风险。该方法可评估某一污染物对整个海水生态系统的生态危害程度, 已广泛应用于生态风险评价领域[53-54]。
首先, 通过式(4)计算 4 种重金属的预测无效应浓度(predicted no effect concentration, PNEC):
式中, HC5 (5% SSD 值)为生态系统中95%的物种不受影响时的最大重金属浓度[53], Hg, Cu, Pb 和 Cd 的HC5 值分别为 0.00138, 0.0019, 0.0369 和 0.00531 μg/g[55]; AF (assessment factor)为不确定因子, 取值为 3[56-57]。
进一步利用式(5)计算重金属污染的风险熵(risk quotient, RQ), RQ<0.1 为低生态风险, 0.1≤RQ<1.0为中度生态风险, RQ≥1.0 为高生态风险。
表1 海水重金属综合污染指数评价标准
Table 1 Evaluation criteria for WQI of heavy metals in seawater

WQI 污染程度WQI≤1 清洁1<WQI≤2 轻度污染2<WQI≤3 中度污染WQI>3 严重污染
式中, MEC (measured environmental concentration)为海水中的实际重金属浓度。
使用 Hakanson 潜在生态风险指数(risk index,RI)法[58]评价沉积物中重金属污染的潜在生态危害和潜在综合生态风险, 计算公式如下:
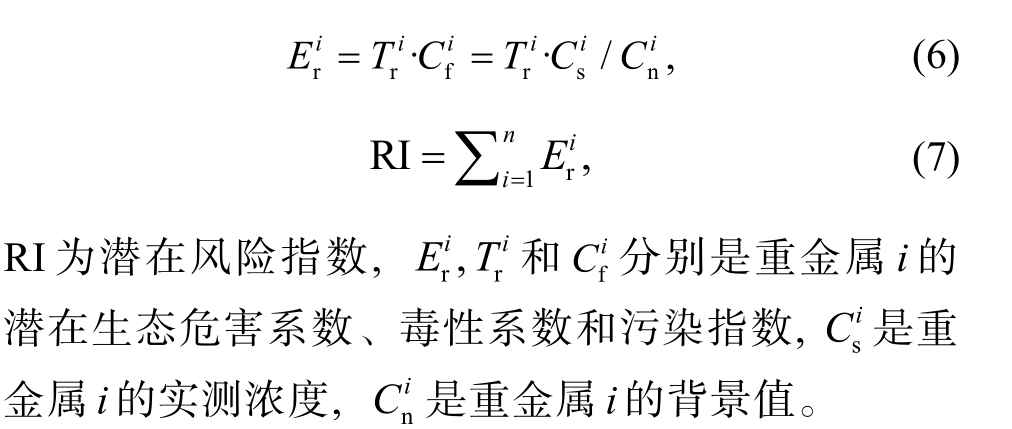
Cd, Cu, Zn, Pb, Cr, Hg 和 As 的毒性系数[58]分别为 30, 5, 1, 5, 2, 40 和 10, 背景值(中国南海海洋沉积物中重金属含量[59])分别为 0.070, 4.75, 44.0, 13.1,23.5, 0.0230 和 4.170 μg/g。 和 RI 的评价标准详见表 2。
表2 重金属潜在生态风险评价标准
Table 2 Evaluation criteria for the potential ecological risk of heavy metals
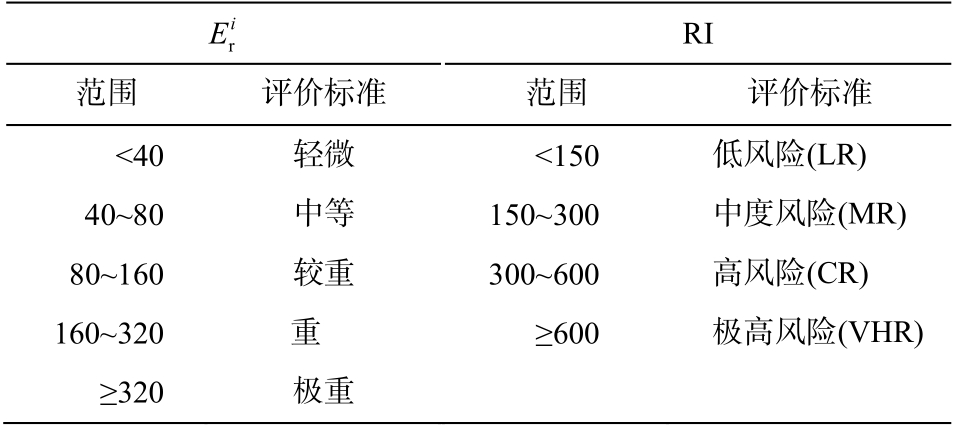
i E RI r范围 评价标准 范围 评价标准<40 轻微 <150 低风险(LR)40~80 中等 150~300 中度风险(MR)80~160 较重 300~600 高风险(CR)160~320 重 ≥600 极高风险(VHR)≥320 极重
2 结果与讨论
2.1 基本理化性质
基于文献数据调研, 整理深圳近岸海域水体和沉积物的基本理化性质, 结果如表 3 和 4 所示。东部海域海水中石油类物质(6.03±25.55 mg/L)、活性磷酸盐(5.28±23.99 mg/L)、无机氮(6.6±25.42 mg/L)和盐度(18.14±14.14 ppt)明显高于西部海域(石油类物质 0.05±0.03 mg/L、活性磷酸盐 0.03±0.03 mg/L、无机氮 1.25±0.48 mg/L 和盐度 8.14±5.28 ppt), 而西部海域海水的 COD (15.06±23.81 mg/L)和 TN(8.01±5.33 mg/L)明显高于东部海域(COD 4.35±25.39 mg/L和 TN 4.32±4.59 mg/L)。就近海沉积物的理化性质而言, 西部海域沉积物盐度(2.64±1.27 ppt)、电导率(5.17±2.43 mS)和 TDS (2.53±1.18 ppt)明显低于东部海域(盐度 4.90 ppt、电导率 9.30 mS 和 TDS 4.65 ppt)。其他指标差别不明显。
表3 深圳近海水体理化性质[13,17-22,32-37]
Table 3 Physicochemical properties of seawater in Shenzhen coastal areas[13,17-22,32-37]

海域 统计值 石油类/(mg·L-1) pH DO/(mg·L-1)COD/(mg·L-1)活性磷酸盐/(mg·L-1)无机氮/(mg·L-1) 盐度/ppt 浊度/NTU TN/(mg·L-1)n 84 116 116 116 84 84 32 32 32西部东部最大值 0.14 8.57 9.13 71.76 0.17 2.38 23.74 62.36 23.16最小值 0.02 6.33 0.87 0.37 0.00 0.17 3.29 15.24 2.20平均值±标准差 0.05±0.03 7.75±0.38 4.99±1.94 15.06±23.81 0.03±0.03 1.25±0.48 8.14±5.28 30.78±10.23 8.01±5.33 n 191 228 199 196 218 191 38 14 14最大值 114.46 8.60 12.90 268.45 114.46 114.46 54.96 114.80 17.81最小值 0.01 7.12 1.79 0.12 0.00 0.02 0.00 1.70 0.87平均值±标准差 6.03±25.55 8.02±0.33 6.44±1.57 4.35±25.39 5.28±23.99 6.6±25.42 18.14±14.14 27.61±39.76 4.32±4.59
表4 深圳近海表层沉积物理化性质[1,28,35,38-43]
Table 4 Physicochemical properties of surface sediments in Shenzhen coastal areas[1,28,35,38-43]
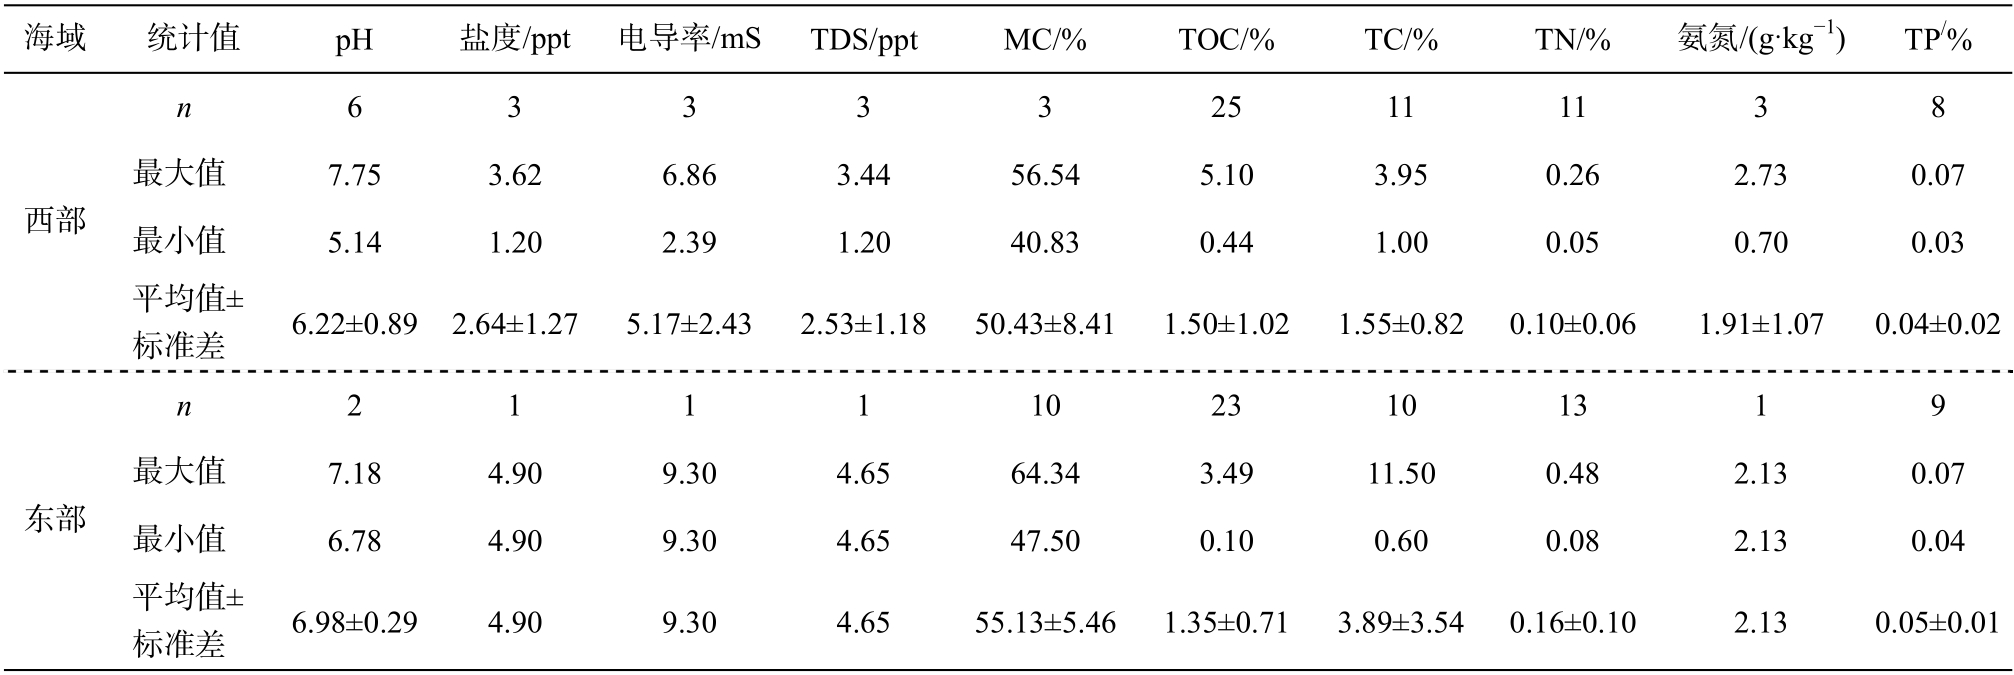
海域 统计值 pH 盐度/ppt 电导率/mS TDS/ppt MC/% TOC/% TC/% TN/% 氨氮/(g·kg-1) TP/%n 6 3 3 3 3 25 11 11 3 8西部东部最大值 7.75 3.62 6.86 3.44 56.54 5.10 3.95 0.26 2.73 0.07最小值 5.14 1.20 2.39 1.20 40.83 0.44 1.00 0.05 0.70 0.03平均值±标准差 6.22±0.89 2.64±1.27 5.17±2.43 2.53±1.18 50.43±8.41 1.50±1.02 1.55±0.82 0.10±0.06 1.91±1.07 0.04±0.02 n 2 1 1 1 10 23 10 13 1 9最大值 7.18 4.90 9.30 4.65 64.34 3.49 11.50 0.48 2.13 0.07最小值 6.78 4.90 9.30 4.65 47.50 0.10 0.60 0.08 2.13 0.04平均值±标准差 6.98±0.29 4.90 9.30 4.65 55.13±5.46 1.35±0.71 3.89±3.54 0.16±0.10 2.13 0.05±0.01
2.2 海水重金属空间分布特征与风险评价
西部海域海水中重金属 Hg, Cu, Pb 和 Cd 的含量均明显高于东部(图 1)。其中, Hg 和 Cd 更明显地集中于西部近海的深圳湾区域(图 1(a)和(d))。
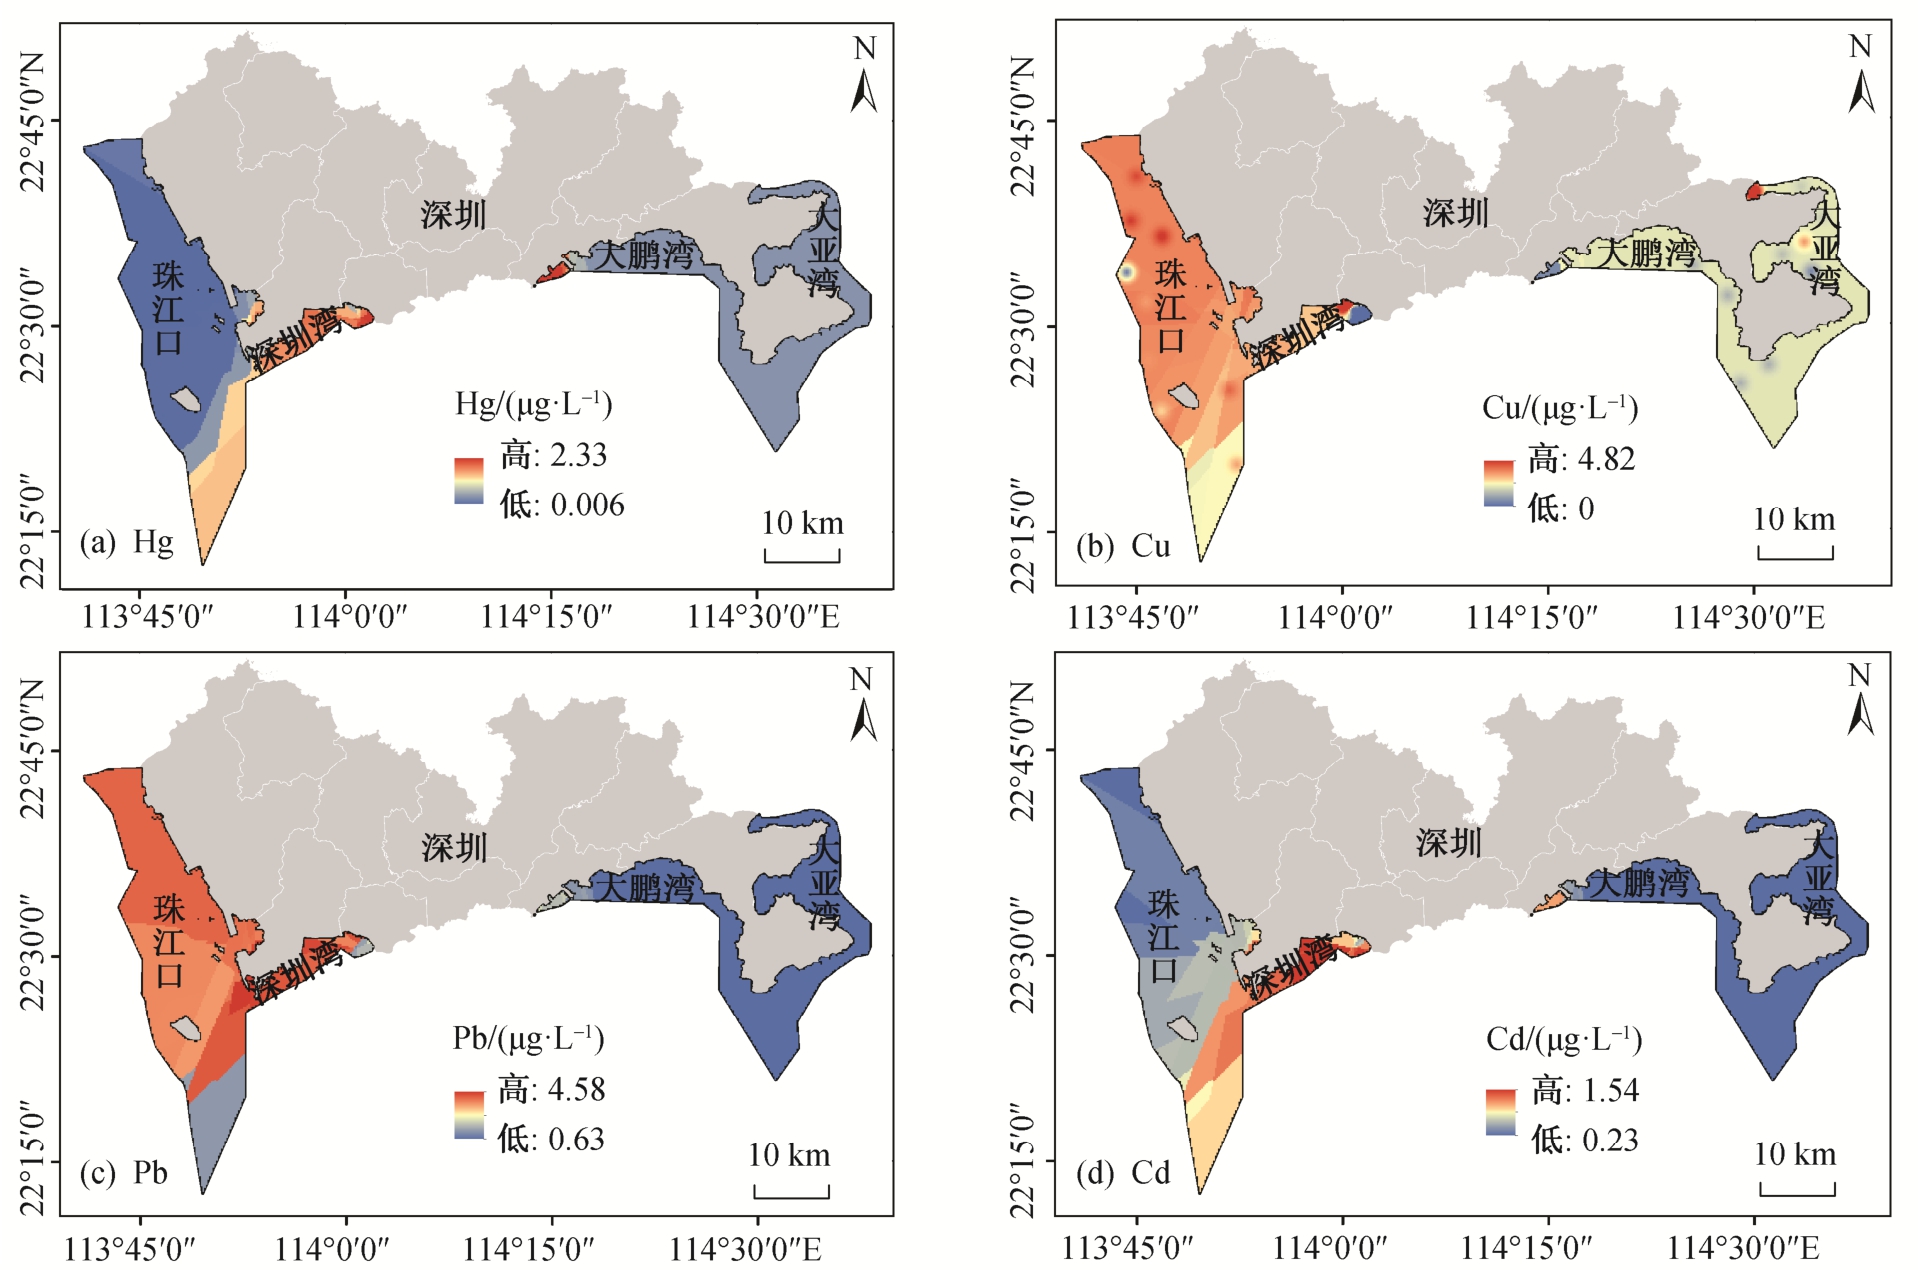
图1 深圳近岸海域水体重金属Hg, Cu, Pb 和Cd 的分布特征
Fig. 1 Distribution characteristics of heavy metals of Hg, Cu, Pb, and Cd in seawater of Shenzhen coastal areas
深圳西部近岸海域主要包含珠江口区域和深圳湾区域, 其水环境受到深圳市及周边区域发展的影响[60]。珠江口区域接纳大量的工业、农业排污及船舶排污, 其中, 近岸排污中工业废水占 47.35%[61], 是珠江口中重金属污染的主要来源。深圳湾是深圳河的河口, 而深圳河的集水区有大量的电子、通信和金属制造产业, 是重要的重金属污染源[62]。另一方面, 作为一种半封闭型海湾, 深圳湾水体交换能力较差, 在接受来自陆源河流输入污染物的同时, 无法快速进行稀释, 因此海水中重金属含量较高。相较于西部近岸海域, 深圳东部近海开发强度较小、陆域生态相对良好、陆源污染清和邻海区水质良好等是其水质较好的原因[63]。
此外, 个别点位的重金属污染情况明显高于周边海域, 如位于东部近海大亚湾的核电近海区域,Cu 含量出现明显的高值, 可能是由海上运输导致。该点位附近是以运输石油化工产品为主的货船停泊地, 货船的压舱水或污水可以导致较高的 Ni, Cr,Zn 和 Cu 含量[64]。沙头角湾口和盐田港区域的 Hg 和 Cd 含量也明显高于东部近海海域。沙头角河排污入海、市政设施不完善以及水交换能力薄弱等问题导致沙头角湾口的环境污染问题[65]; 盐田港及码头燃料燃烧、交通排放及焚烧等增加了区域内降水中的重金属含量[66], 也是造成海水重金属污染的原因之一。
如图 2 所示, 深圳近岸海域海水重金属的 WQI综合污染指数全部高于第一类海水水质标准(WQI>1), 无清洁海域。其中, 西部近海的大铲湾、深圳湾出口、深圳湾出口和珠江口下游的外海汇集区以及东部近海的沙头角湾口区域重金属综合污染程度为严重污染。珠江口中段的大部分区域为轻微污染, 其他大部分区域为中度污染。东部近岸海域除沙头角湾口外, 均为中度污染。彭勃等[67]通过归纳文献数据, 发现位于深圳东部近海的大亚湾海水中重金属污染程度较轻, 但部分位置的重金属含量有超标现象, 本研究结论与之相似。
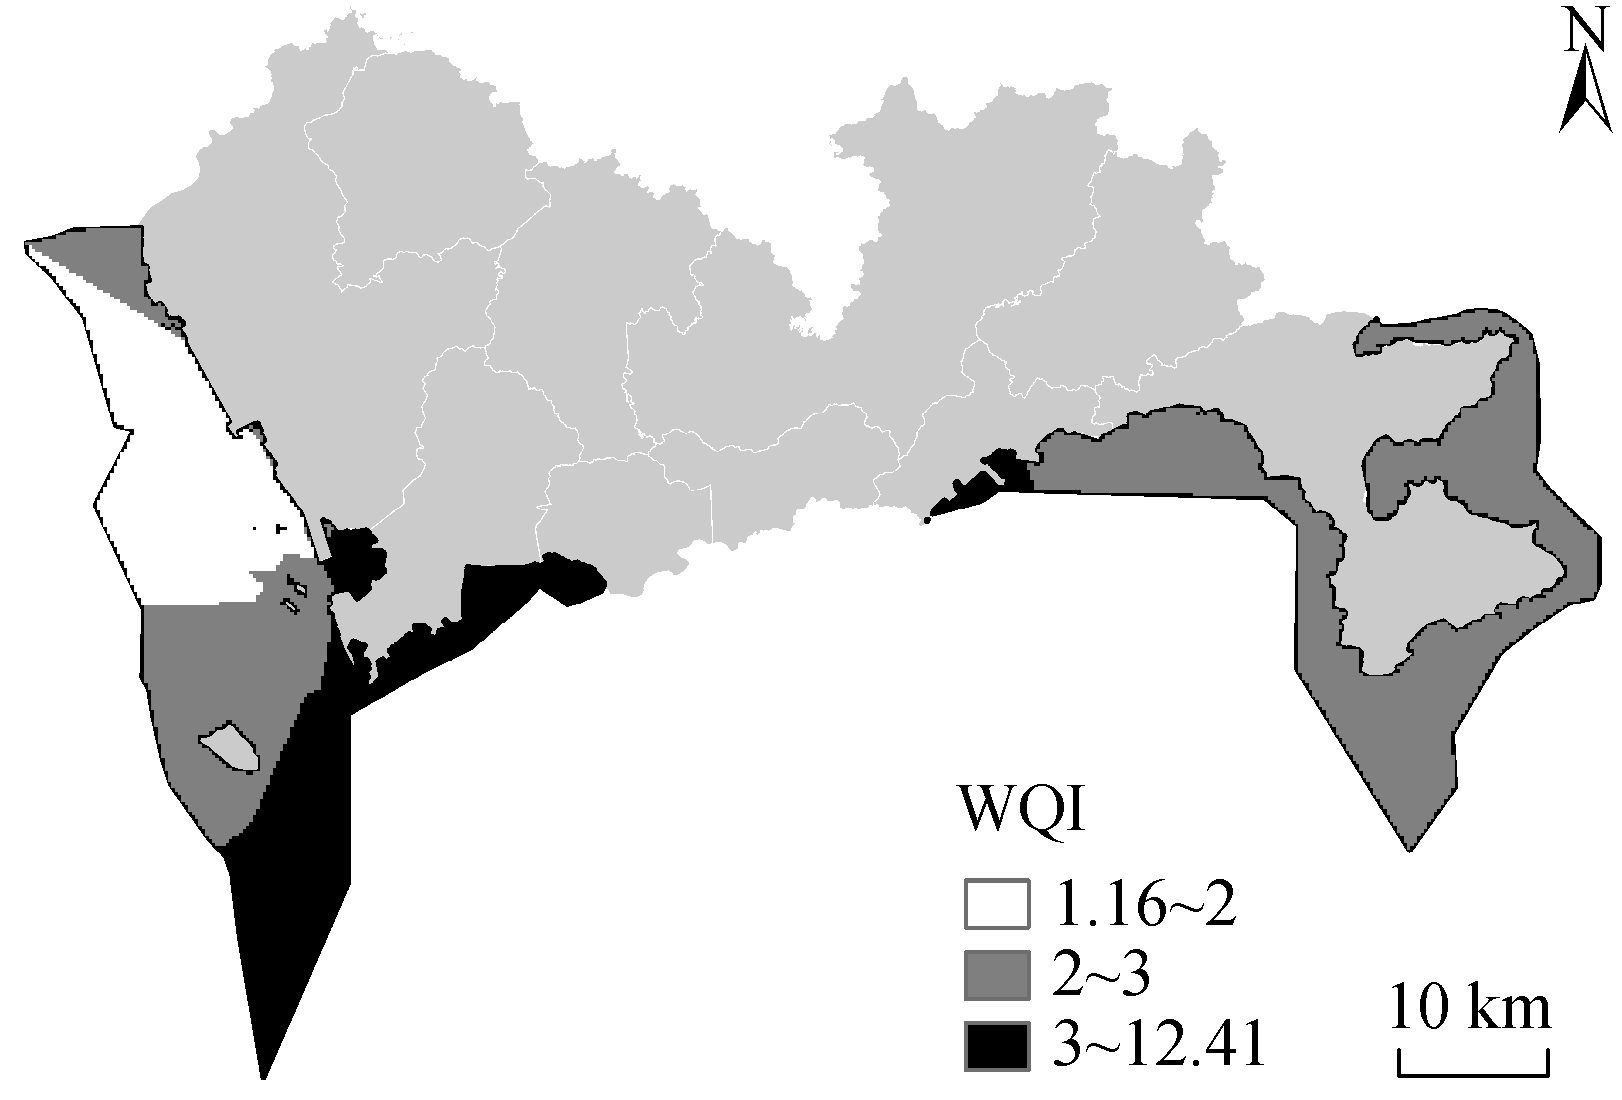
图2 基于第一类海水水质标准的深圳近岸海域水体重金属综合污染情况
Fig. 2 Pollution levels of heavy metals in seawater of Shenzhen coastal areas based on the first category of Sea Water Quality Standard
从海水重金属元素的风险熵(RQ)来看, 深圳近岸海域水体中 4 种重金属生态风险排序为 Cu>Hg>Cd>Pb (图 3)。Cu 的生态风险最高, 深圳近岸海域Cu 的生态风险均达到高风险水平(图 3(b))。Hg 的RQ 高值出现在深圳湾海域附近和东部海域, 处于高风险水平(图 3(a))。Pb (图 3(c))和 Cd (图 3(d))的风险熵较低, 处于中等生态风险水平。
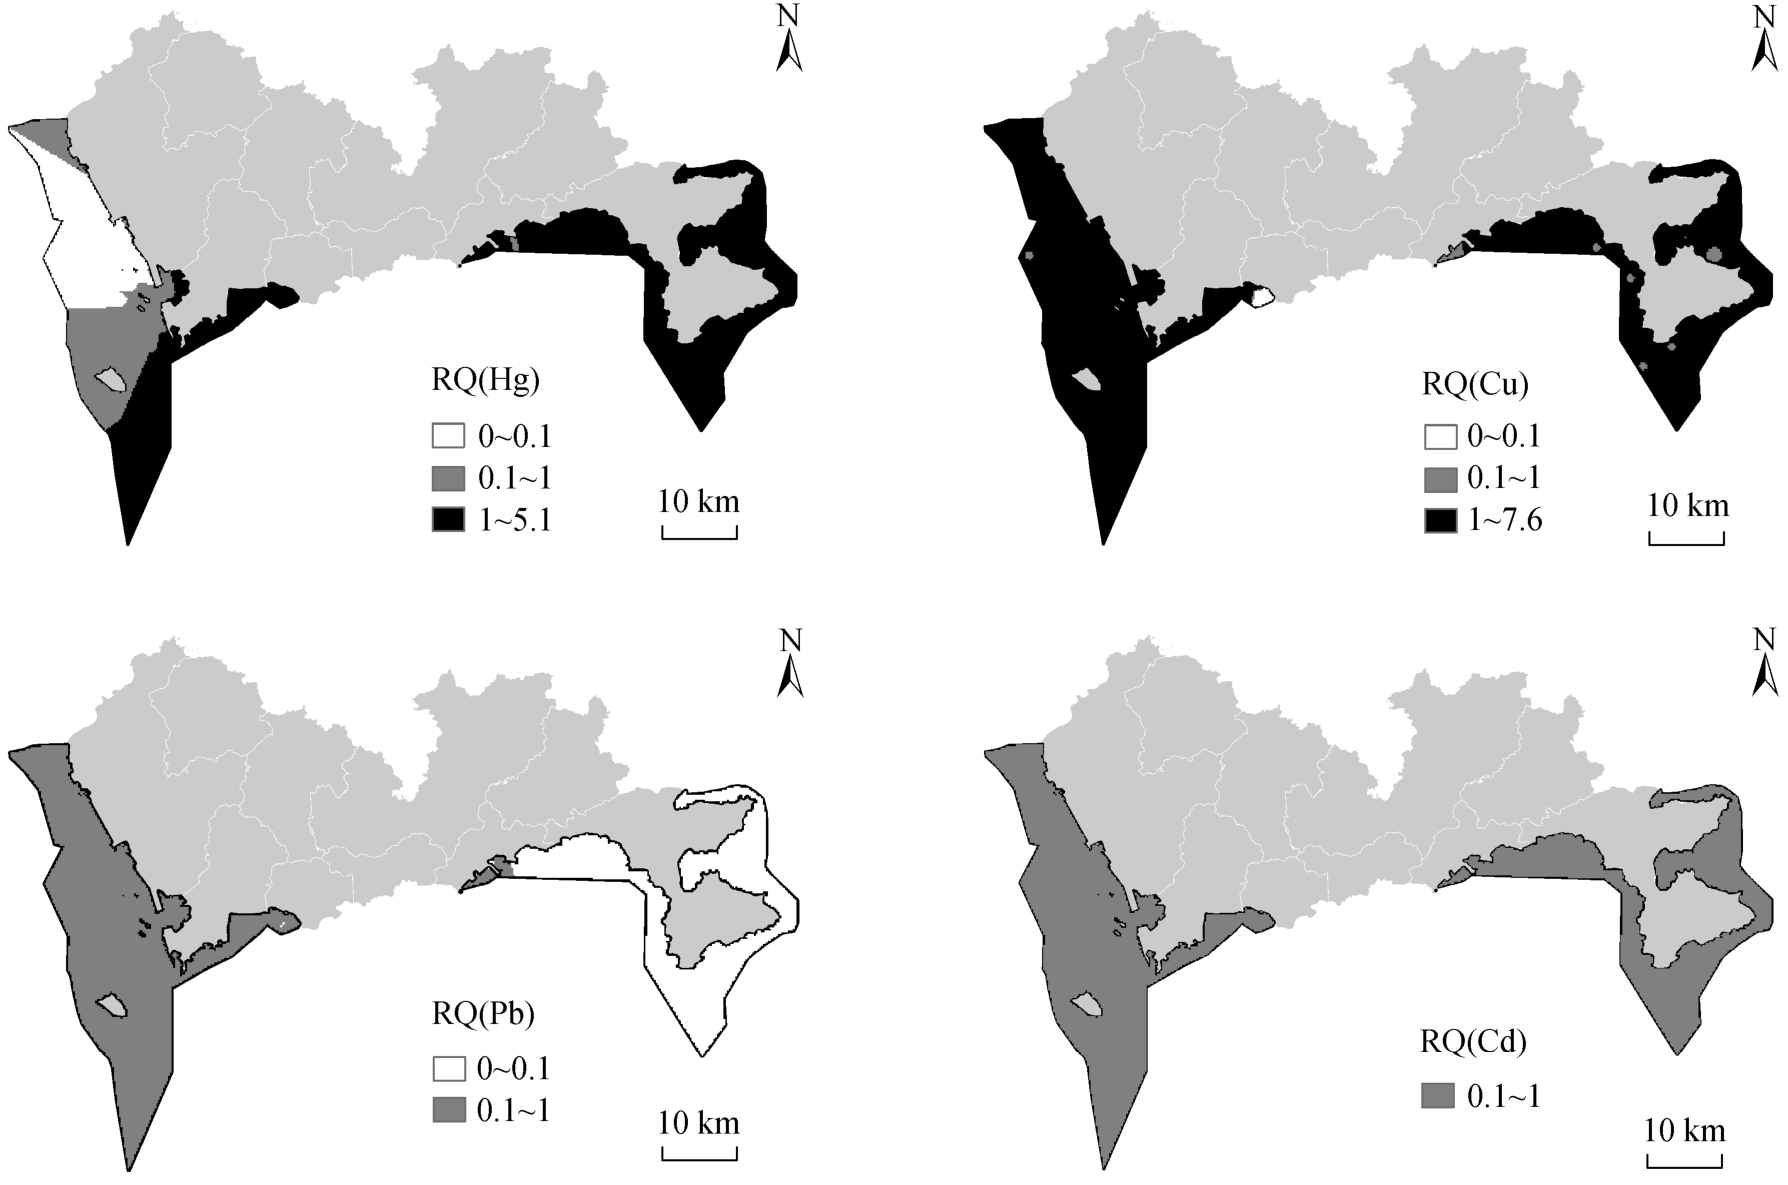
图3 深圳近岸海域水体重金属Hg, Cu, Pb 和Cd 风险熵(RQ)的分布特征
Fig. 3 Distribution of risk quotient (RQ) of heavy metals Hg, Cu, Pb, and Cd in seawater of Shenzhen coastal areas
2.3 沉积物重金属空间分布特征与风险评价
深圳近岸海域表层沉积物中 Cd 含量呈现显著的西高东低变化趋势(图 4(a)), 并且在靠近珠江河口区域沉积物中达到最高值, 说明西部近海沉积物中 Cd 主要来源于珠江的输入。这与海水中 Cd 西高东低的变化趋势一致, 但海水中 Cd 含量高值主要出现在深圳湾区域, 其原因可能是深圳湾水体交换能力较弱。从图 4(b)看出, 与 Cd 的分布相似, 深圳近岸西部海域表层沉积物中 Cu 含量在靠近珠江河口区域达到最高值, 而在其他区域的含量较低, 且与海水中 Cu 含量的分布趋势一致, 说明 Cu 也主要来源于珠江的输入。深圳近岸西部海域表层沉积物中 Zn 含量从外海向湾内呈现显著增加的趋势(图4(c)), 珠江口和大亚湾区域的 Zn 浓度较高, 说明其污染主要来源于珠江输入, 并在一定程度上呈现陆源排放的特点。深圳近岸海域表层沉积物中 Pb 含量呈现显著的西北高、东南低变化趋势(图 4(d)),且在西部海域, 沉积物中 Pb 含量从外海向珠江口区域呈现显著增加的趋势。海水 Pb 含量也具有相似的分布特征, 具有由珠江和深圳沿岸输入的特征。珠江口和大亚湾及附近海域表层沉积物中 Cr含量显著高于其他海域(图 4(e)), 且从外海向近岸区域呈现显著增加的趋势。深圳近岸海域表层沉积物中 Hg 含量在深圳湾区域最高(图 4(f)), 其次为大鹏湾, 其他海域相对较低, 与海水中 Hg 的分布特征一致, 说明深圳湾周边区域是深圳近海环境 Hg 污染的主要输入区。深圳近岸海域表层沉积物中的As 污染则集中在深圳湾和大亚湾区域(图 4(g))。
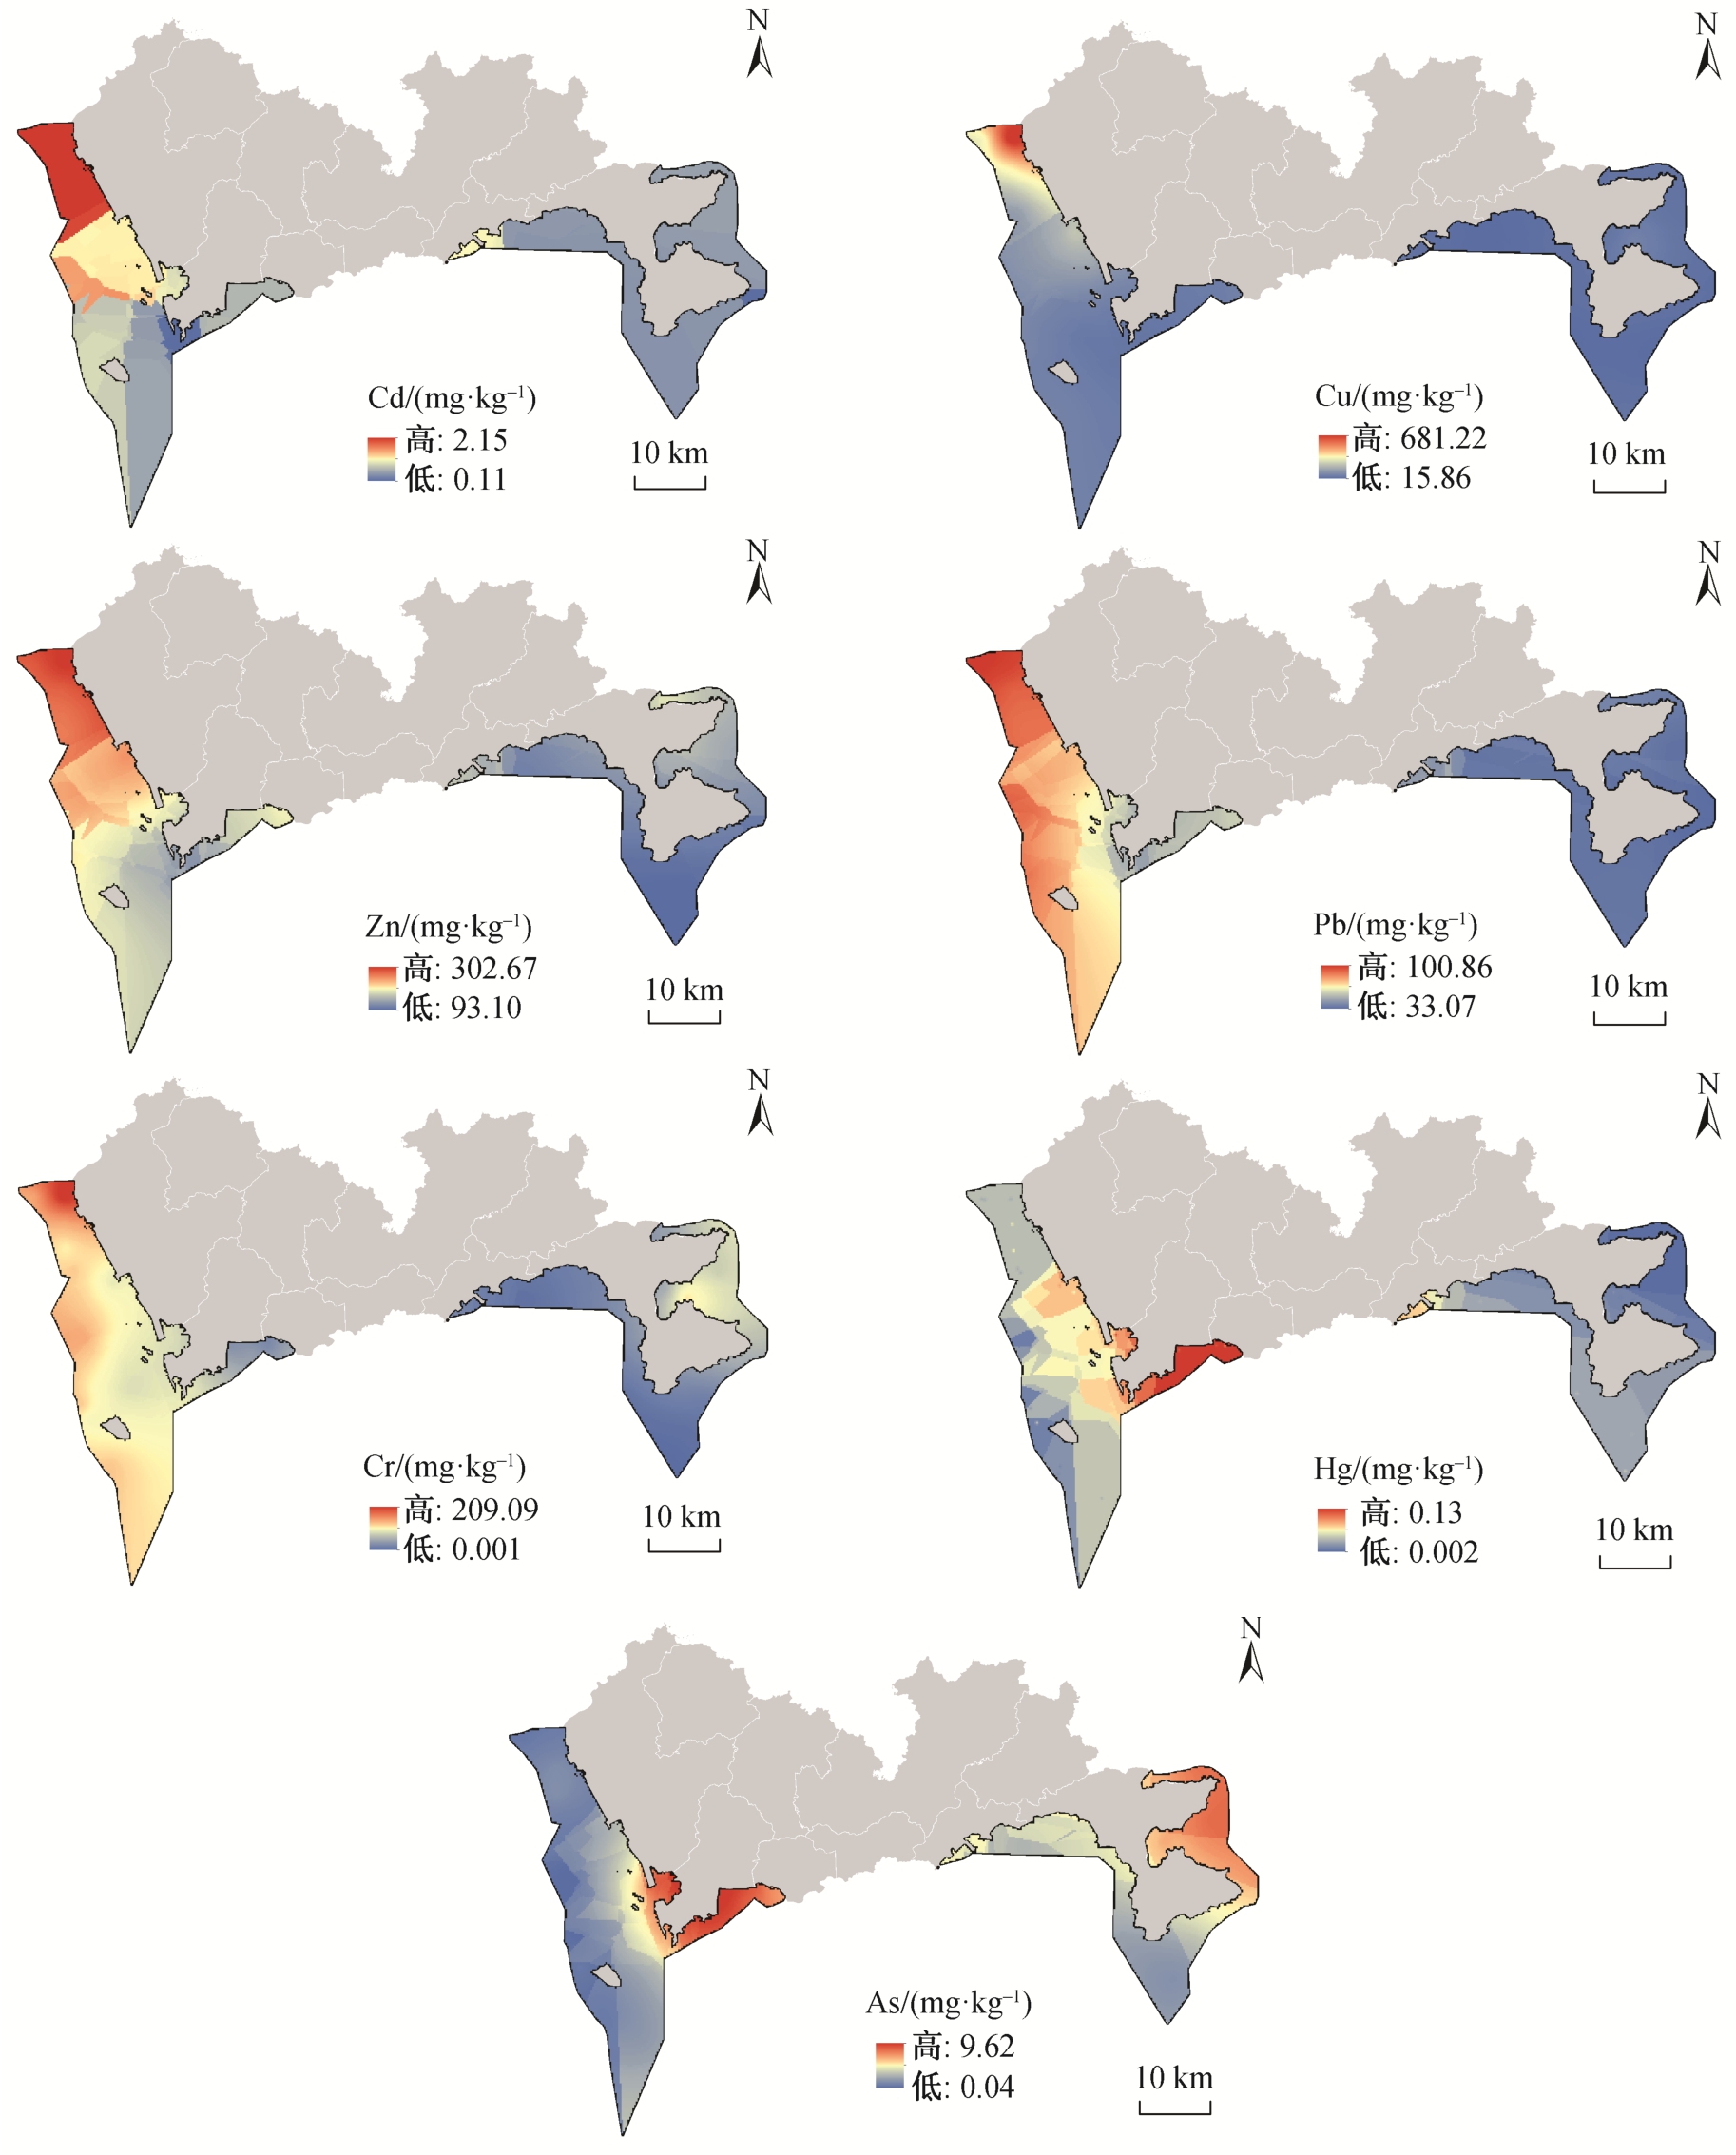
图4 深圳近岸海域表层沉积物重金属Cd, Cu, Zn, Pb, Cr, Hg 和As 的分布特征
Fig. 4 Distribution characteristics of heavy metals Cd, Cu, Zn, Pb, Cr, Hg and As in surface sediments of Shenzhen coastal areas
总体而言, 珠江口区域表层沉积物的 Cd, Cu,Zn, Pb 和 Cr 含量显著高于其他海域, 空间变化趋势也较为相似, 呈现从珠江口西北部上游向东南部海域递减的趋势。除 Cu 外, 其他重金属(Cd, Zn, Pb和 Cr)在珠江口西岸的含量高于东岸, 可能与陆源污染物质的排放和水动力条件有关[68]。Hg 高含量区为深圳湾和大鹏湾区域, As 高含量区则为深圳湾和大亚湾区域。张起源等[69]基于 2014—2016 年广东省海洋沉积物监测数据, 得出珠江口海域沉积物中 6 种重金属(Cd, Cu, Zn, Pb, Cr 和 As)含量显著高于其他区域的结论。倪志鑫等[70]发现珠江口海域表层沉积物中 6 种重金属(Cd, Cu, Zn, Pb, Cr 和 As)总量呈现从西北向东南逐渐减小的趋势, 且西岸浓度普遍高于东岸, 其中 As 在深圳湾海域附近出现高值, 本文结果与之基本上一致。不同区域重金属的来源可能存在差异, Ye 等[23]的研究表明, 在珠江口表层沉积物中, Cr, Ni, Cu, Zn, As, Cd 和 Pb 是人为污染物中主要的重金属, 重金属之间存在显著的相关关系, 主要来自工业和未经处理的废污水。深圳湾海域沉积物中的重金属 Hg 是周围城市工业废水排放、上游径流的输入及环境因素影响共同作用的结果[71-72], 而 As 含量较高可能与深圳湾蛇口港煤炭运输相关。在运输过程中, 煤灰可能在风力或水流的作用下进入深圳湾海域沉积物中, 使得深圳湾海域 As 含量明显高于其他海域[12,71]。Xu 等[73]认为大鹏湾和汕头湾表层沉积物中的 Hg 含量显著高于中国南方其他沿海海湾, 可能受到沿海地区人为活动的直接影响(如繁忙的海上交通和密集的工业活动)。大亚湾海域表层沉积物中的 As 含量高值可能与大规模海水养殖相关[25], 因为有机砷饲料经常用作海水养殖的饲料添加剂[25,74]。
本研究以中国南海海洋沉积物中重金属含量为背景值, 基于深圳近岸海域表层沉积物重金属含量
空间插值的结果计算重金属潜在生态风险指数( )和综合潜在生态风险指数(RI)。
从单种重金属元素来看, 7 种重金属潜在生态危害系数排序为 Cd>Cu>Hg>Zn, Pb, Cr, As。其中,Cd 的生态风险最高, 在西部海域及大亚湾海域, Cd的潜在危害达到“极重”水平, 其他海域基本上处于“重”潜在生态危害水平(图 5(a))。西部海域 Cu 的潜在生态危害系数大于东部海域, 在西部海域靠近珠江口河口达到最大, 潜在生态危害程度达“极重”水平。由河口向下游, 危害系数逐渐减小, 至深圳湾海域附近 Cu 的危害程度降至“中等”, 东部海域 Cu 的危害较轻(图 5(b))。Hg 的生态危害系数高值出现在深圳湾海域附近, 基本上处于“较重”水平, 部分海域可达“重”潜在生态危害水平; 其他海域 Hg 的生态危害较轻(图 5(f))。深圳近岸海域内重金属 Zn (图5(c))、Pb (图 5(d))、Cr (图 5(e))和 As (图 5(g))的潜在生态危害系数较低, 表明这 4 种重金属基本上不存在生态风险。
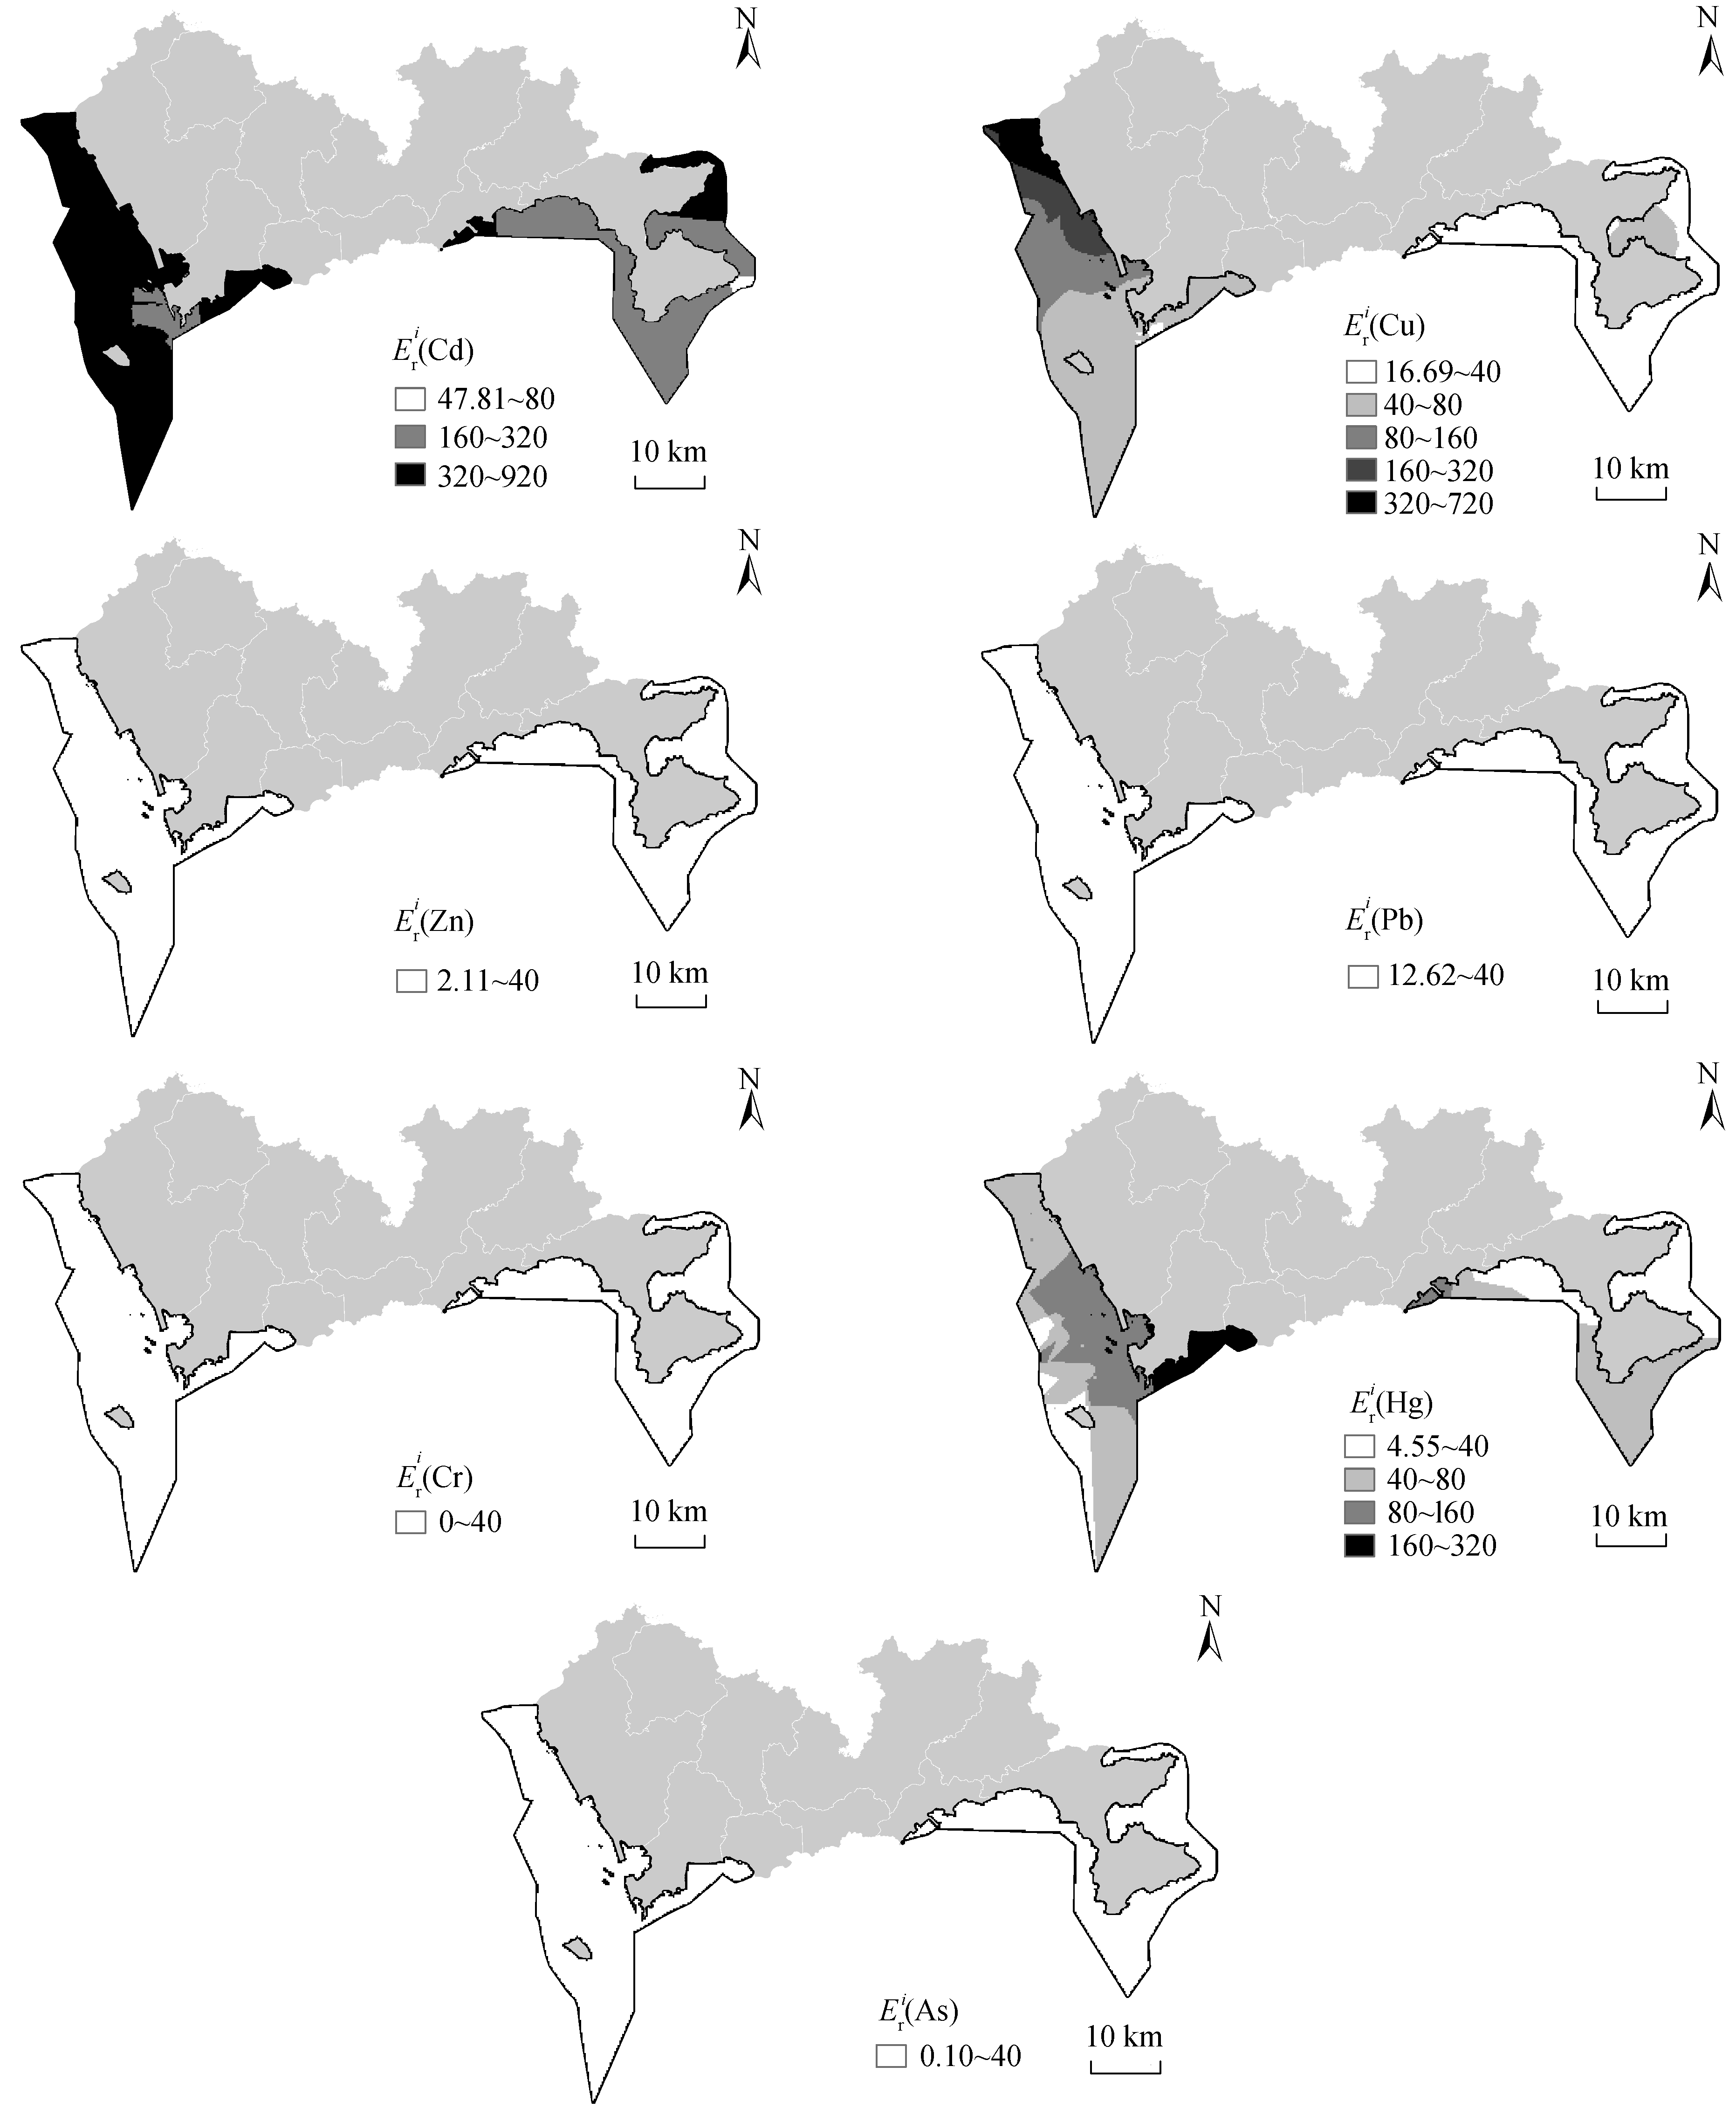
图5 深圳近岸海域表层沉积物重金属Cd, Cu, Zn, Pb, Cr, Hg 和As 的潜在生态危害系数分布特征
Fig. 5 Distribution characteristics of potential ecological hazard indices of heavy metals Cd, Cu, Zn, Pb, Cr, Hg,and As in surface sediments of Shenzhen coastal areas
从总体污染程度来看, 深圳近岸海域综合潜在生态风险基本上处于“极高风险”和“高风险”水平(图6)。西部海域的综合潜在生态风险显著高于东部海域, 其中, 西部海域珠江口和深圳湾的大部分近岸海域处于“极高风险”水平, 西部的远岸海域处于“高风险”水平; 而东部海域基本上处于“高风险”水平。重金属 Cd 是影响深圳近岸海域生态健康的主要重金属元素。张起源等[69]对广东省海域沉积物中重金属的生态风险进行评估, 结果表明生态危害程度顺序为珠江口>粤东>粤西, 其中 Cd 的生态危害度最高, 其次为 Cu。刘解答等[75]、倪志鑫等[70]和唐得昊等[12]的研究表明, Cd 是目前珠江口、深圳湾海域最主要的潜在生态危害因子, 达到“重”生态风险。本文研究结果与上述工作一致。深圳近岸海域综合潜在生态风险整体较高, 高风险区集中于珠江口、深圳湾所在的西部海域, 与珠江三角洲地区社会经济水平较高, 人类活动较频繁有密切关系[69]。
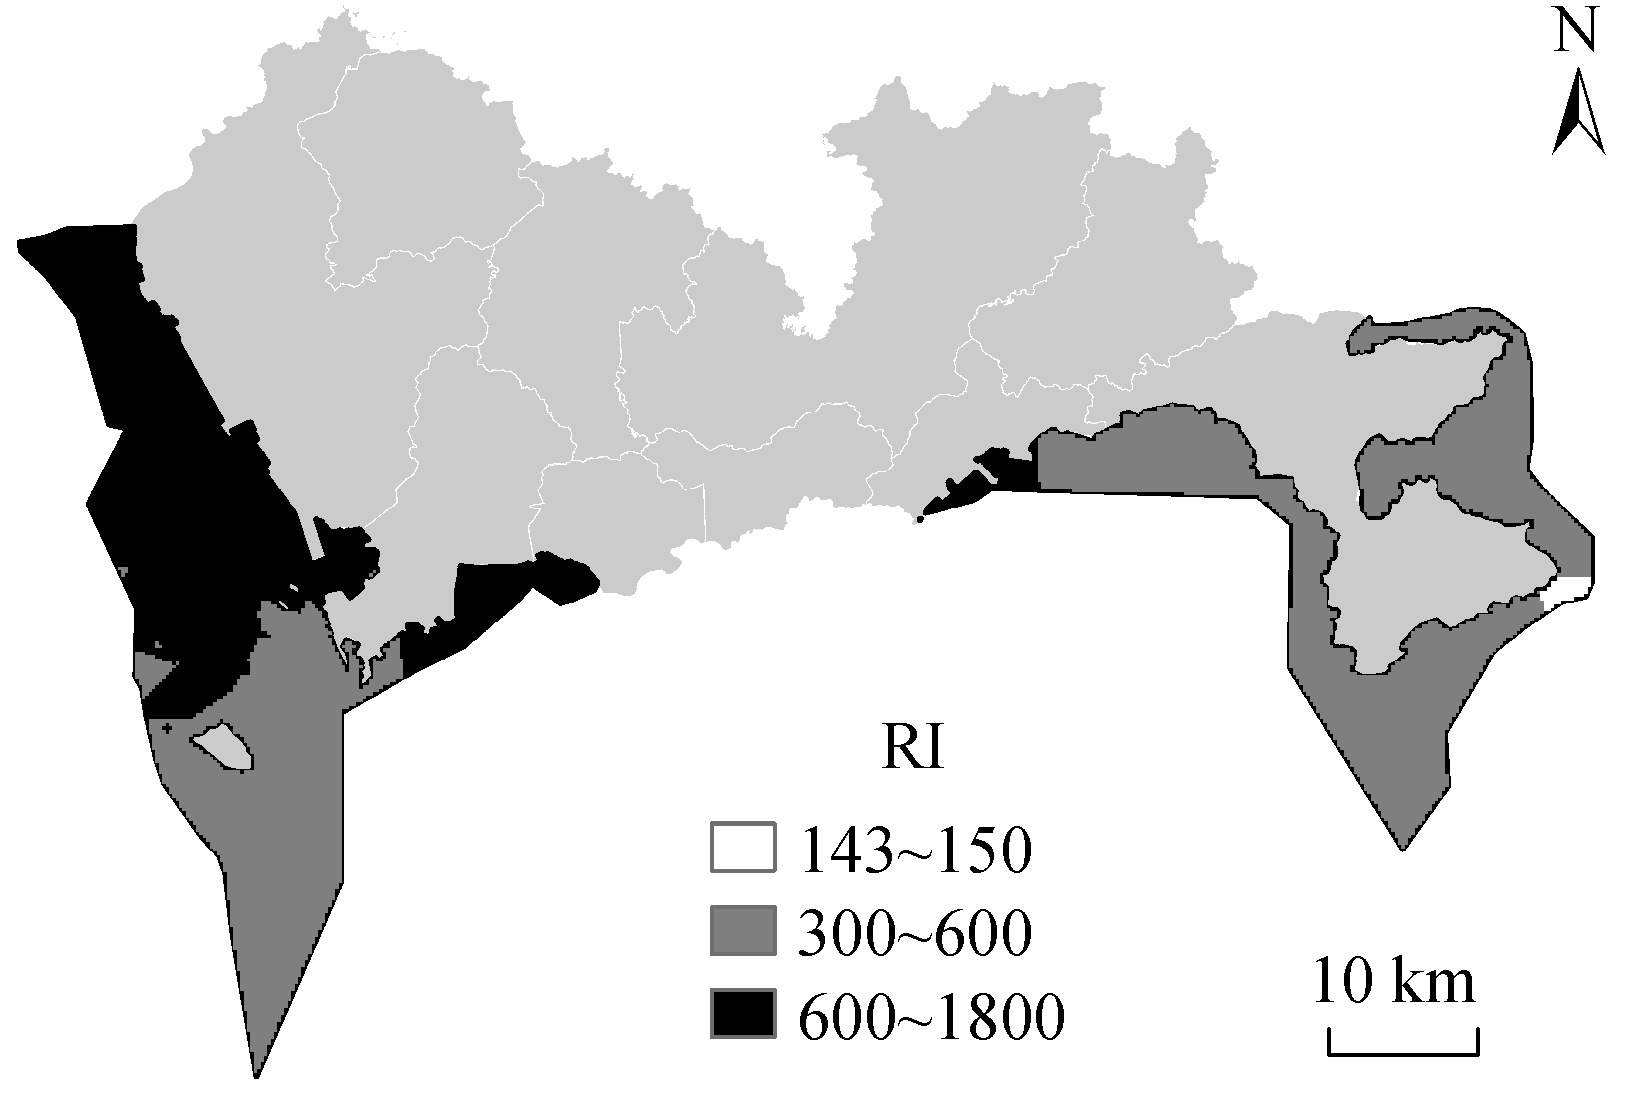
图6 深圳近岸海域表层沉积物重金属潜在风险指数的分布特征
Fig. 6 Distribution characteristics of potential ecological risk index of heavy metals in surface sediments of Shenzhen coastal areas
3 结论与建议
海水中重金属 Hg, Cu, Pb 和 Cd 的含量均明显呈现西部高于东部的特点。其中, Hg 和 Cd 更明显地集中于西部近海的深圳湾区域。
基于第一类海水水质标准的深圳近岸海域海水4 种重金属(Hg, Cu, Pb 和 Cd)的 WQI 综合污染指数表明深圳近海无清洁水体(WQI>1)。其中, 西部近海的大铲湾、深圳湾出口、深圳湾出口和珠江口下游的外海汇集区以及东部近海的沙头角湾口区域的重金属综合污染程度为严重污染, 其余大部分区域为中度污染。近海海水重金属生态风险多处于高风险和中风险水平, 依次为 Cu>Hg>Cd>Pb。
深圳近海表层沉积物重金属空间分布总体上呈现湾内高、湾外低的特点, 珠江口区域表层沉积物的重金属 Cd, Cu, Zn, Pb 和 Cr 含量显著高于其他海域, 呈现从珠江口西北部上游向东南部海域递减的特点; Hg 含量高值区为深圳湾和大鹏湾区域, As 含量高值区则为深圳湾和大亚湾区域; 表层沉积物中重金属的高含量大多与频繁的人类活动相关, 且与海水中相应重金属含量的分布趋势一致。
深圳近海表层沉积物重金属的综合潜在生态风险极高, 7 种重金属中潜在生态危害最大的为 Cd,其次为 Cu 和 Hg。深圳近海重金属潜在生态风险不可忽视, 应严控污水排放, 加强风险监控。
[1] Chai M W, Li R L, Ding H, et al. Occurrence and contamination of heavy metals in urban mangroves: a case study in Shenzhen, China. Chemosphere, 2019,219: 165-173
[2] Garmendia M, de Vallejuelo S F, Liñero O, et al. Long term monitoring of metal pollution in sediments as a tool to investigate the effects of engineering works in estuaries: a case study, the Nerbioi-Ibaizabal estuary(Bilbao, Basque Country). Marine Pollution Bulletin,2019, 145: 555-563
[3] Zhang H, Walker T R, Davis E, et al. Ecological risk assessment of metals in small craft harbour sediments in Nova Scotia, Canada. Marine Pollution Bulletin,2019, 146: 466-475
[4] Christophoridis C, Bourliva A, Evgenakis E, et al.Effects of anthropogenic activities on the levels of heavy metals in marine surface sediments of the Thessaloniki Bay, Northern Greece: spatial distribution,sources and contamination assessment. Microchemical Journal, 2019, 149: 104001
[5] Marchand C, Lallier-Vergès E, Baltzer F, et al. Heavy metals distribution in mangrove sediments along the mobile coastline of French Guiana. Marine Chemistry,2006, 98(1): 1-17
[6] Shi C, Ding H, Zan Q J, et al. Spatial variation and ecological risk assessment of heavy metals in mangrove sediments across China. Marine Pollution Bulletin, 2019, 143: 115-124
[7] Zhang Z W, Xu X R, Sun Y X, et al. Heavy metal and organic contaminants in mangrove ecosystems of China: a review. Environmental Science and Pollution Research, 2014, 21(20): 11938-11950
[8] 贾振邦, 霍文毅, 赵智杰, 等. 应用次生相富集系数评价柴河沉积物重金属污染. 北京大学学报(自然科学版), 2000, 36(6): 808-812
[9] Wu J S, Song J, Li W F, et al. The accumulation of heavy metals in agricultural land and the associated potential ecological risks in Shenzhen, China. Environmental Science and Pollution Research, 2016, 23(2): 1428-1440
[10] 李瑞利, 柴民伟, 邱国玉, 等. 近 50 年来深圳湾红树林湿地 Hg、Cu 累积及其生态危害评价. 环境科学, 2012, 33(12): 4276-4283
[11] 赵一阳, 鄢明才. 浅海沉积物地球化学. 北京: 科学出版社, 1994
[12] 唐得昊, 刘兴健, 邹欣庆. 海湾表层沉积物重金属污染与潜在生态危害评价——以深圳湾为例. 环境化学, 2014, 33(8): 1294-1300
[13] 深圳市海洋局. 2017 年深圳市海洋环境状况公报[R]. 深圳: 深圳市海洋局, 2017
[14] 段一明, 张戈, 于大涛. 辽东湾西北部海域沉积物重金属含量分析及污染评价. 海洋开发与管理,2020, 37(1): 39-45
[15] Belal H M, Shafiuddin A A S, Islam S M S. Human health risks of Hg, As, Mn, and Cr through consumption of fish, Ticto barb (Puntius ticto) from a tropical river, Bangladesh. Environmental science and pollution research international, 2018, 25(31): 31727-31736
[16] Gerstenberger S L, Martinson A, Kramer J L. An evaluation of mercury concentrations in three brands of canned tuna. Environmental Toxicology and Chemistry, 2010, 29(2): 237-242
[17] Zhang D W, Zhang X, Tian L, et al. Seasonal and spatial dynamics of trace elements in water and sediment from Pearl River Estuary, South China. Environmental earth sciences, 2013, 68(4): 1053-1063
[18] 杨华, 王少鹏, 余克服, 等. 南海北部珊瑚生长区海水重金属污染特征. 生态环境学报, 2017, 26(2):253-260
[19] 刘慧杰, 刘文君, 刘继平, 等. 南中国海表层海水重金属含量及其潜在生态风险分析. 中国环境科学,2017, 37(10): 3891-3898
[20] 王佐霖, 马鹏飞, 张卫强, 等. 深圳坝光湿地地表水水环境质量评价. 林业与环境科学, 2019, 35(4):9-17
[21] 许观嫦, 徐颂军, 宋焱, 等. 深圳红树林自然保护区海水重金属质量评价. 华南师范大学学报(自然科学版), 2015, 47(1): 101-108
[22] 深圳市环境监测中心站. 深圳市环境质量报告书(2018 年度)[R]. 深圳: 深圳市环境监测中心站,2019
[23] Ye Z P, Chen J Y, Gao L, et al. 210Pb dating to investigate the historical variations and identification of different sources of heavy metal pollution in sediments of the Pearl River Estuary, Southern China.Marine Pollution Bulletin, 2020, 150: 110670
[24] Huang F W, Xu Y, Tan Z H, et al. Assessment of pollutions and identification of sources of heavy metals in sediments from west coast of Shenzhen,China. Environmental Science and Pollution Research, 2018, 25(4): 3647-3656
[25] Liu J J, Ni Z X, Diao Z H, et al. Contamination level,chemical fraction and ecological risk of heavy metals in sediments from Daya Bay, South China Sea. Marine Pollution Bulletin, 2018, 128: 132-139
[26] Chen L. Current situation and ecological risk analysis of heavy metal pollution in surface sediments of Shenzhen Bay. World Scientific Research Journal,2019, 5(9): 189-194
[27] Feng J X, Zhu X S, Wu H, et al. Distribution and ecological risk assessment of heavy metals in surface sediments of a typical restored mangrove-aquaculture wetland in Shenzhen, China. Marine Pollution Bulletin, 2017, 124(2): 1033-1039
[28] Yang G H, Song Z G, Sun X L, et al. Heavy metals of sediment cores in Dachan Bay and their responses to human activities. Marine Pollution Bulletin, 2020,150: 110764
[29] Lu X X, Wang Z H, Guo X, et al. Impacts of metal contamination and eutrophication on dinoflagellate cyst assemblages along the Guangdong coast of southern China. Marine Pollution Bulletin, 2017, 120(1/2): 239-249
[30] Qu B, Song J, Yuan H, et al. Intensive anthropogenic activities had affected Daya Bay in South China Sea since the 1980s: evidence from heavy metal contaminations. Marine Pollution Bulletin, 2018, 135: 318-331
[31] Liang P, Wu S, Zhang J, et al. The effects of mariculture on heavy metal distribution in sediments and cultured fish around the Pearl River Delta region,south China. Chemosphere, 2016, 148: 171-177
[32] 刘解答. 珠江口表层海水中营养盐与表层沉积物中重金属的分布和影响的调查研究[D]. 湘潭: 湘潭大学, 2016
[33] 中华人民共和国自然资源部. 2015 年海水水质监测信息[EB/OL]. (2016-12-30) [2020-10-15]. http://gc.mnr.gov.cn/201806/t20180614_1794781.html
[34] 中华人民共和国自然资源部. 2016 年海水水质监测信息[EB/OL]. (2017-11-24) [2020-10-15]. http://gc.mnr.gov.cn/201806/t20180614_1794783.html
[35] Liu J J, Diao Z H, Xu X R, et al. In situ arsenic speciation and the release kinetics in coastal sediments: a case study in Daya Bay, South China Sea.Science of The Total Environment, 2019, 650: 2221-2230
[36] Mai Y Z, Peng S Y, Lai Z N. Structural and functional diversity of biofilm bacterial communities along the Pearl River Estuary, South China. Regional Studies in Marine Science, 2020, 33: 100926
[37] 牛志远, 沈小雪, 柴民伟, 等. 深圳湾福田红树林区水环境质量时空变化特征. 北京大学学报(自然科学版), 2018, 54(1): 137-145
[38] Yang Y Q, Chen F R, Zhang L, et al. Comprehensive assessment of heavy metal contamination in sediment of the Pearl River Estuary and adjacent shelf. Marine Pollution Bulletin, 2012, 64(9): 1947-1955
[39] Deng L, Liu G H, Zhang H M, et al. Levels and assessment of organotin contamination at Futian Mangrove Wetland in Shenzhen, China. Regional Studies in Marine Science, 2015, 1: 18-24
[40] 黄小平, 郭芳, 黄良民. 大鹏澳养殖区柱状沉积物中氮、磷的分布特征及污染状况研究. 热带海洋学报, 2010, 29(1): 91-97
[41] 王朝晖, 李友富, 牟德海. 大亚湾大鹏澳海域 C、N、BSi 的沉积记录研究. 海洋环境科学, 2010,29(1): 1-7
[42] 丁苏丽. 深港两地红树林沉积物中重金属污染及其与微生物群落结构的关系[D]. 深圳: 深圳大学,2018
[43] 许春玲, 李绪录, 林梵. 深圳湾及邻近沿岸沉积物中碳、氮和磷的分布. 中国环境科学, 2017, 37(7):2691-2698
[44] Xie Y F, Chen T B, Lei M, et al. Spatial distribution of soil heavy metal pollution estimated by different interpolation methods: accuracy and uncertainty analysis. Chemosphere, 2011, 82(3): 468-476
[45] Belkhiri L, Mouni L, Sheikhy Narany T, et al. Evaluation of potential health risk of heavy metals in groundwater using the integration of indicator kriging and multivariate statistical methods. Groundwater for Sustainable Development, 2017, 4: 12-22
[46] 吴翠晴, 李楠, 王亚涛, 等. 空间插值方法在锦州湾海水富营养化评价中的应用. 水资源与水工程学报, 2012, 23(6): 116-119
[47] Lin Y P, Cheng B Y, Shyu G S, et al. Combining a finite mixture distribution model with indicator kriging to delineate and map the spatial patterns of soil heavy metal pollution in Chunghua County, central Taiwan. Environmental Pollution, 2010, 158(1): 235-244
[48] Jeong S, Park J, Kim Y M, et al. Innovation of flux chamber network design for surface methane emission from landfills using spatial interpolation models.Science of The Total Environment, 2019, 688: 18-25
[49] Li J, Heap A D. Spatial interpolation methods applied in the environmental sciences: a review. Environmental Modelling & Software, 2014, 53: 173-189
[50] 谢云峰, 陈同斌, 雷梅, 等. 空间插值模型对土壤Cd 污染评价结果的影响. 环境科学学报, 2010, 30(4): 847-854
[51] Horton R K. An index number system for rating water quality. Journal of Water Pollution Control Federation, 1965, 37(3): 300-306
[52] 国家海洋局第三海洋研究所, 青岛海洋大学. 海水水质标准[S]. 国家环境保护局, 1997
[53] Wheeler J R, Grist E P M, Leung K M Y, et al.Species sensitivity distributions: data and model choice. Marine Pollution Bulletin, 2002, 45: 192-202
[54] Newman M C, Ownby D R, Mezin L C A, et al.Applying species-sensitivity distributions in ecological risk assessment: assumptions of distribution type and sufficient numbers of species. Environmental Toxicology and Chemistry: An International Journal,2000, 19(2): 508-515
[55] Durán I, Beiras R. Ecotoxicologically based marine acute water quality criteria for metals intended for protection of coastal areas. Science of The Total Environment, 2013, 463/464: 446-453
[56] 王宏伟, 乔艳珍, 王丽平. 天津渤海湾 4 种重金属的分布及生态风险评价. 水生态学杂志, 2017, 38(2): 38-43
[57] European Chemicals Bureau. Technical Guidance Document on Risk Assessment-Part II [R]. Ispra: Institute for Health and Consumer Protection, 2003
[58] Hakanson L. An ecological risk index for aquatic pollution control. A sedimentological approach. Water research, 1980, 14(8): 975-1001
[59] 暨卫东. 中国近海海洋环境质量现状与背景值研究.北京: 海洋出版社, 2011
[60] Huang Y L, Zhu W B, Le M H, et al. Temporal and spatial variations of heavy metals in urban riverine sediment: an example of Shenzhen River, Pearl River Delta, China. Quaternary International, 2012, 282:145-151
[61] 黄向青, 张顺枝, 霍振海. 深圳大鹏湾、珠江口海水有害重金属分布特征. 海洋湖沼通报, 2005(4):38-44
[62] 刘永伟, 毛小苓, 孙莉英, 等. 深圳市工业污染源重金属排放特征分析. 北京大学学报(自然科学版),2010, 46(2): 279-285
[63] 林高松, 黄晓英. 深圳东西部近岸海域水质评价,对比与分析. 环境科学与管理, 2009, 34(8): 159-163
[64] Tang H, Ke Z, Yan M, et al. Concentrations, distribution, and ecological risk assessment of heavy metals in Daya Bay, China. Water, 2018, 10: 80
[65] 黄劲绮, 何召新, 许洁忠, 等. 沙头角湾海水质量改善对策研究. 环境, 2006(增刊1): 109-111
[66] 蒋冰艳, 何龙, 陈德华, 等. 深圳近海区域降水中重金属湿沉降通量及源解析. 环境化学, 2018, 37(7): 1460-1473
[67] 彭勃, 彭加喜, 孙凯峰. 大亚湾及邻近海域重金属污染的研究进展. 生态科学, 2015, 34(3): 170-180
[68] Chatterjee M, Silva Filho E V, Sarkar S K, et al.Distribution and possible source of trace elements in the sediment cores of a tropical macrotidal estuary and their ecotoxicological significance. Environment International, 2007, 33(3): 346-356
[69] 张起源, 刘谞承, 赵建刚, 等. 广东沿海沉积物重金属含量及风险评价. 中国环境科学, 2018, 38(12):4653-4660
[70] 倪志鑫, 张霞, 蔡伟叙, 等. 珠江口沉积物中重金属分布、形态特征及风险分析. 海洋环境科学,2016, 35(3): 321-328
[71] 时运红, 李明远, 李波, 等. 深圳湾沉积物重金属污染时空分布特征. 海洋环境科学, 2017, 36(2):186-191
[72] Shi C, Yu L, Chai M, et al. The distribution and risk of mercury in Shenzhen mangroves, representative urban mangroves affected by human activities in China. Marine Pollution Bulletin, 2020, 151: 110866
[73] Xu W H, Yan W, Huang W X, et al. Mercury profiles in surface sediments from ten bays along the coast of Southern China. Marine Pollution Bulletin, 2013, 76(1/2): 394-399
[74] Siano F, Bilotto S, Nazzaro M, et al. Effects of conventional and organic feed on the mineral composition of cultured European sea bass (Dicentrarchus labrax). Aquaculture Nutrition, 2017, 23(4): 796-804
[75] 刘解答, 郭亮, 柯志新. 珠江口表层沉积物中重金属污染及生态风险评价. 水生态学杂志, 2017, 38(1): 46-53