快速城市化流域全氟化合物的污染特征及生态风险
王之芬1 梁新秀1 占笔成2 吴疆1 高月1 许楠1,†
1.深圳市重金属污染控制与资源化重点实验室, 北京大学深圳研究生院环境与能源学院, 深圳 518055; 2.深圳市龙华区环境保护和水务局, 深圳 518000
摘要 为探究快速城市化地区城市河流中全氟化合物(PFCs)的污染特征, 于枯水期和丰水期分别采集深圳市观澜河干流的表层水样, 通过固相萃取法处理水样, 并利用超高效液相色谱–三重四级杆串联质谱(UPLC-ESI-MS/MS)技术分析 11 种 PFCs 的含量。结果表明, 丰水期和枯水期观澜河干流水体中 PFCs 的含量分别为 179.15~613.68 和 37.04~103.70ng/L。其中, 全氟己烷磺酸(PFHxS)、全氟丁烷磺酸(PFBS)、全氟己酸(PFHxA)和全氟辛酸(PFOA)是主要污染物。所采集的样品中, 丰水期 PFCs 的浓度高于枯水期, 下游采样点 PFCs 的浓度高于上中游河段。与已报道的其他水体相比, 由于流域的快速城市化, 观澜河水体的 PFCs 含量水平较高。生态风险评估表明, 水体中检出的 PFCs 均不会对水体造成生态风险。
关键词 全氟化合物; 城市河流; 时空分布; 来源解析; 风险评估
全氟化合物(perfluorinated compounds,PFCs)是一类新型环境有机污染物, 其生产和使用可以追溯到 20 世纪 50 年代[1]。这些物质具有独特的性质, 如较高的表面活性和稳定性等, 广泛用于纺织、化工、电子、制药、航空和电镀等领域[2–7], 通过多种途径进入各种环境介质中, 如土壤、水体和大气等[5,8–9]。PFCs 中, 应用最多的是全氟辛酸(PFOA)和全氟辛烷磺酸(PFOS), 是环境中存在的两种主要PFCs物质, 也是研究最广的两种PFCs[10]。
2002 年 3M 公司禁止生产 PFCs 后, 中国大陆开始大规模生产 PFCs, 并且集中在中部和东部地区。2009 年, PFOS 及其母体化合物氟辛烷磺酰氟(PFOSF)被列入斯德哥尔摩公约的附录 B[11–12], 但包括中国在内的发展中国家仍在大量使用。PFCs 已成为危害我国生态环境尤其是水环境安全的重要污染物。有报道显示, 中国中部和东部地区受到 PFCs的高污染, 尤其是长江三角洲地区[9–10,13–14]。对中国PFCs 污染特征的研究集中在北方工业区和城市地区的湖泊、河流以及 PFCs 的污染源地区(如市政污水处理厂和氟化工厂)[8,15–16]。对南方地区的研究集中在珠江[17], 对珠江三角洲快速城市化地区的河流研究较少。
作为快速城市化流域, 观澜河已通过支流截流和污水处理厂出水补水等措施对干流进行整治, 但流域的 PFCs 污染特征尚不明确, PFCs 对河流产生的生态风险需进一步研究。鉴于上述背景, 本文对观澜河水体中 PFCs 含量、组成和时空分布特征进行研究, 并分析 PFCs 的污染来源和生态风险, 以期为快速城市化流域有机污染物治理提供理论基础和参考依据。
1 材料与方法
1.1 试剂与材料
11 种 PFCs 标准样品(7 种全氟羧酸及其盐类化合物(PFCAs)、4 种全氟磺酸及其盐类化合物(PFSAs))和两种 PFC 同位素内标物(13C12-PFOS 和13C12-PFOA)从百灵威公司(中国)购买, 其理化性质如表 1 所示。实验所用试剂均为色谱纯, 购自百灵威公司。Oasis HLB (6 mL, 500 mg, Waters, USA)固相萃取柱购自上海安普公司。实验用水为 Milli-Q 超纯水。
1.2 样品采集
观澜河位于深圳市中北部, 是深圳市和东莞市的界河。它是一条雨源性河流, 集雨面积为 189.3 km2, 河长 22.56km, 是东江的一级支流。多年平均降水量为 1825mm, 降雨集中在 4—9 月, 占全年总降水量的 85%, 根据降雨情况, 可分为丰水期(4—9月)和枯水期(10 月—次年 3 月)[18]。
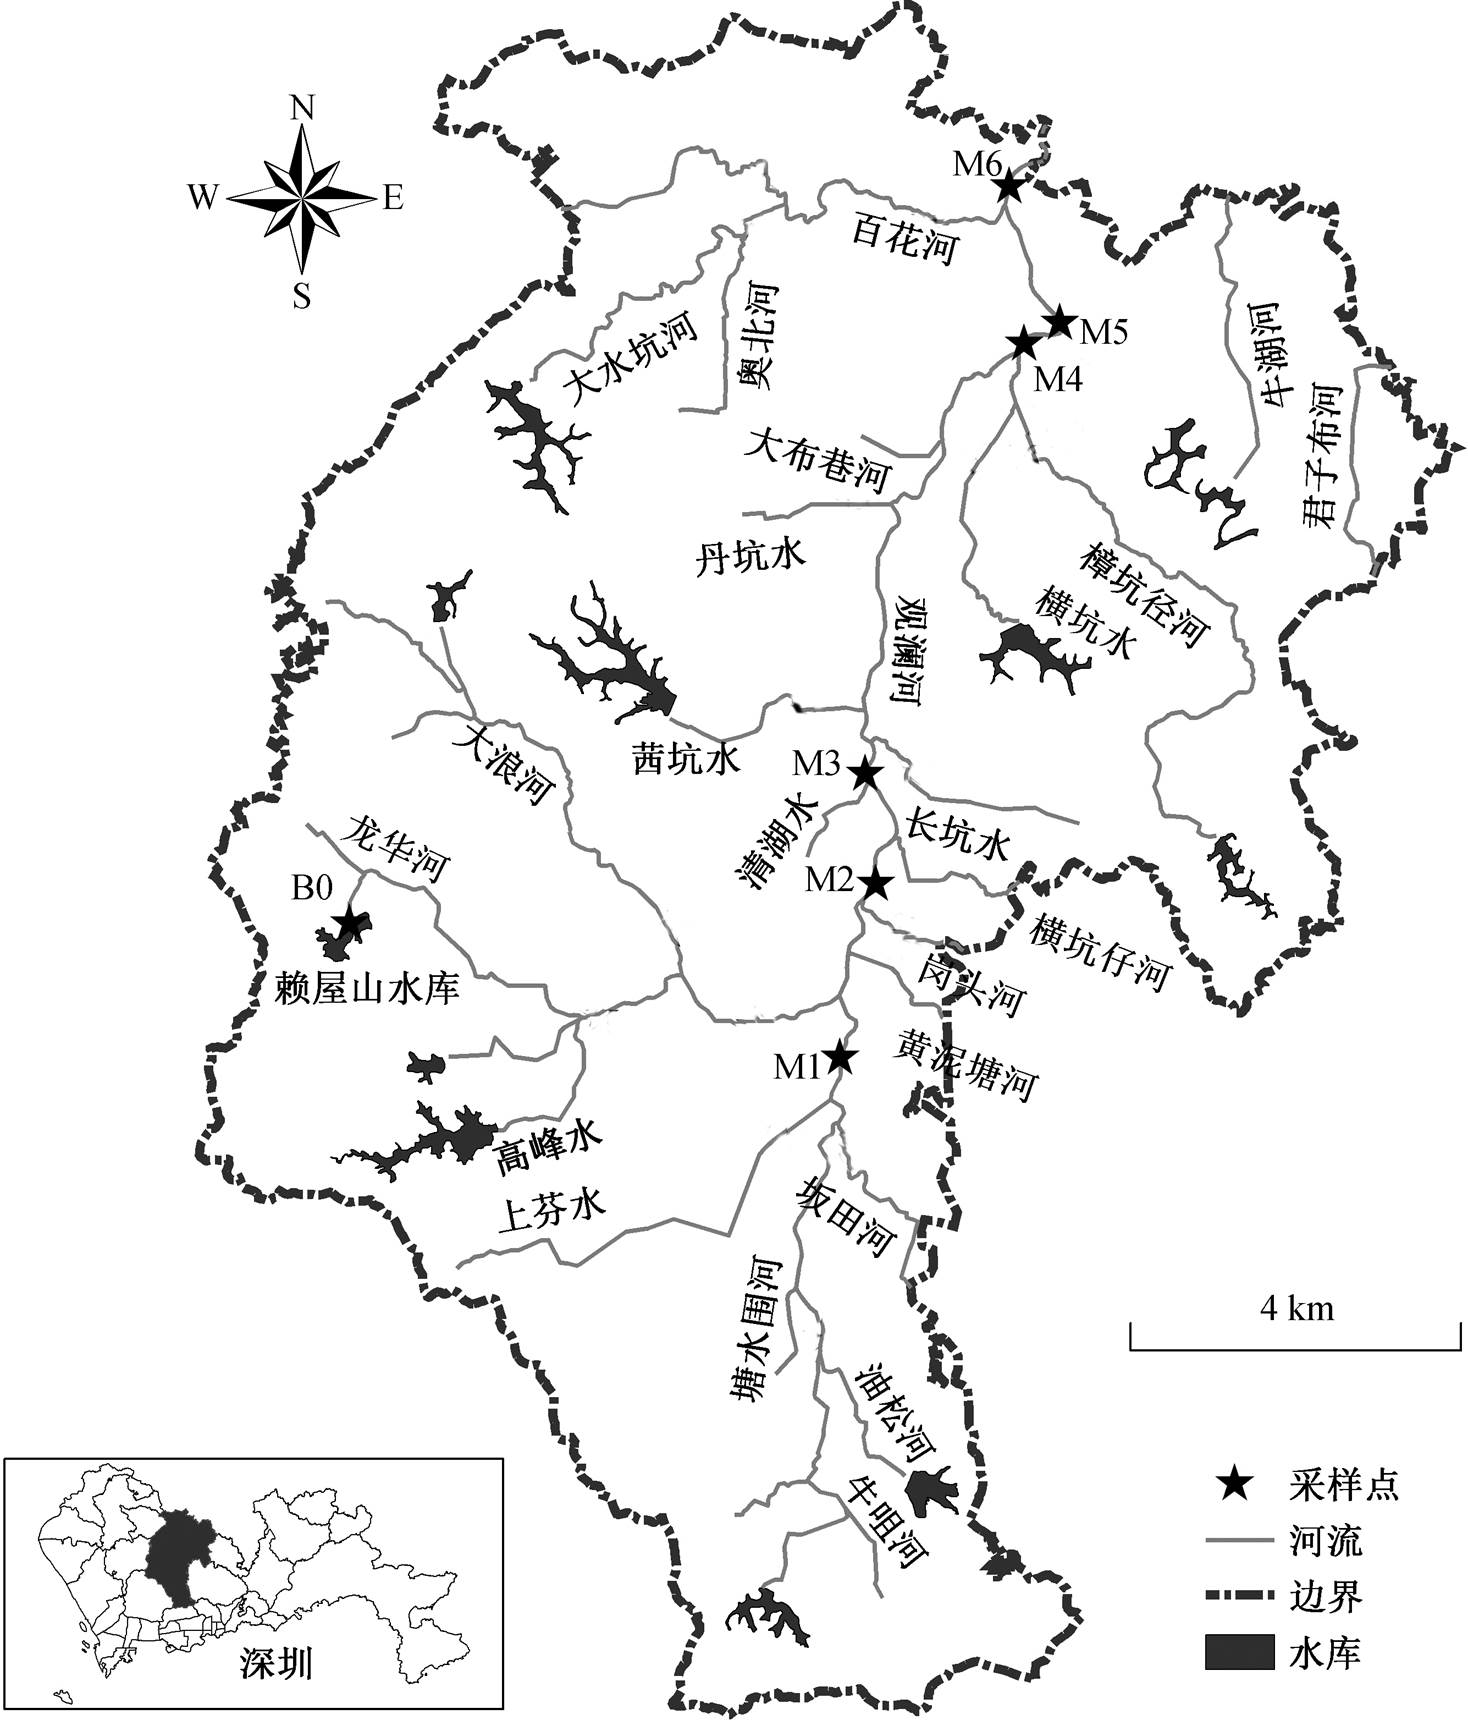
本研究布设 7 个采样点, 其中 6 个(M1~M6)位于观澜河的干流, 1 个(B0)位于赖屋山水库, 作为背景值。采样点分布如图 1 所示, 详细信息见表 2。于枯水期(2015 年 11 月)和丰水期(2017 年 6 月)采集样品, 每个采样点采集水样 4L, 储存于聚丙烯瓶中, 0~4ºC 避光保存, 运回实验室, 并于 24 小时内完成固相萃取。
1.3 样品预处理
水样经 0.45μm玻璃纤维滤膜(GF/F, Whatman)过滤后, 取 1L 滤液加入 50ng13C12-PFOS 和 13C12-PFOA 混合内标液。取 Oasis HLB 固相萃取小柱, 分别用 10mL 甲醇和 10mL 超纯水活化, 然后进行水样固相萃取, 控制流速为 15mL/min, 上样后用 10mL 超纯水淋洗, 抽干。最后用 10mL 甲醇进行洗脱, 收集洗脱液, 氮吹至干并通过离心去除颗粒物, 甲醇定容至 1mL, 转入进样小瓶, 待仪器分析。
表1 PFCs的理化性质
Table 1 Physical and chemical properties of PFCs

物质简称CAS#分子量分子式Sw/(mg·L−1)logKowpKaP/Pa分类碳链 全氟己酸PFHXA307-24-4314.05C6HF11O2157004.37−0.161333PFCAs短链 全氟庚酸PFHpA375-85-9364.06C7HF13O25.33PFCAs中链 全氟辛酸PFOA335-67-1414.07C8HF15O234006.302.504.2PFCAs中链 全氟壬酸PFNA375-95-1464.08C9HF17O27.26PFCAs中链 全氟癸酸PFDA335-76-2514.09C10HF19O28.23PFCAs中链 全氟十一烷酸PFUnDA4234-23-5564.09C11HF21O29.20PFCAs长链 全氟十二烷酸PFDODA307-55-1614.10C12HF23O210.16PFCAs长链 全氟丁烷磺酸PFBS375-73-5300.102C4HF9O3S510002.730.14PFSAs短链 全氟辛烷磺酸PFOS1763-23-1500.133C8HF17O3S5706.28-3.270.000331PFSAs中链 全氟己烷磺酸PFHxS3871-99-6400.117C6HF13O3S14004.340.14PFSAs短链 全氟十四烷酸PFTA376-06-7664.10C14HF27O2PFCAs长链
说明: Sw为水溶解度, Kow为辛醇–水分配系数(25ºC), pKa为酸度系数(25ºC), P为饱和蒸汽压(20ºC)。
表2 采样点详细信息
Table 2 Detailed information of sampling locations

采样点编号位置纬度(N)经度(E)是否补水点备注 M1上游114°2′12.0″22°39′11.1″否 M2中游114°2′24.5″22°40′21.3″是污水处理厂污水处理量5.12万m3/d M3中游114°2′22.6″22°41′18.6″是污水处理厂污水处理量11.57万m3/d M4下游114°3′40″22°44′7″否 M5下游114°3′33″22°44′7″是污水处理厂污水处理量28.22万m3/d M6下游114°03′28.0″22°45′18.7″否 B0上游113° 59' 41"22°40′30″水库
说明: 补水为污水处理厂出水。
1.4 仪器分析
采用超高效液相色谱三重四级杆串联质谱仪(UPLC-ESI-MS/MS, Agilent 1290-6460A, 美国)进行样品分析。
色谱条件色谱柱为 ZORBAX Eclipse Plus C18(2.1×50mm,1.8μm, Agilent, 美国); 流动相 A 为水, 流动相 B 为 100%乙腈(ACN); 进样量为 3 μL。梯度洗脱条件: 流速为 0.25mL/min, 流动相初始比例为 95%的水和 5%的 ACN; 第 1~6 分钟, 流动相比例由初始比例线性变化为 5%的水和 95%的 ACN; 第 6~8 分钟, 95%的 ACN 维持不变; 第 8~13 分钟, 流动相比例线性地变化至初始值。整个分析过程历时 13分钟。
质谱条件釆用电喷雾离子化源, 负离子电离模式(ESI−); 多重反应检测方式(MRM); 气体温度为 350°C; 流速为 9L/min; 雾化器压力为 35psi; 毛细管电压为 3500V, 加速电压为 200V; 内标法定量, 目标化合物及内标物的质谱参数见表3。
1.5 质量控制与保证
实验涉及的材料均使用聚丙烯材质, 使用前先用甲醇润洗。为控制前处理过程中可能引入的外源性污染, 每批样品都做全程空白实验, 所有实验结果均为扣除基质空白后的数据。为保证数据结果的可靠性, 每个采样点做两个平行样品, 平行测定结果的偏差小于 10%。同时, 每测定 10 个样品就测定一个溶剂空白样品, 质控样品偏差小于 10%, 空白样品未检出或小于样品测定值的 10%。水样中 11 种PFCs 的基质加标回收率为 32.0%~193.5%, 相对标准偏差范围为 1.1%~17.9%, 检出限和定量限分别是信噪比的 3 倍和 10 倍, 其范围分别为 0.01~ 0.13和0.03~0.43 ng/L。
1.6 生态风险评估
目前应用较多的生态风险评估方法是风险商值(RQ)法。由于缺乏 PFCs 毒性数据, 只获得 5 种PFCs 的预测无效应浓度值。水体中 5 种 PFCs 的风险商值计算公式[19]如下:
表3 目标化合物及内标物的质谱参数
Table 3 Mass spectrometry parameters of target compounds and internal standards
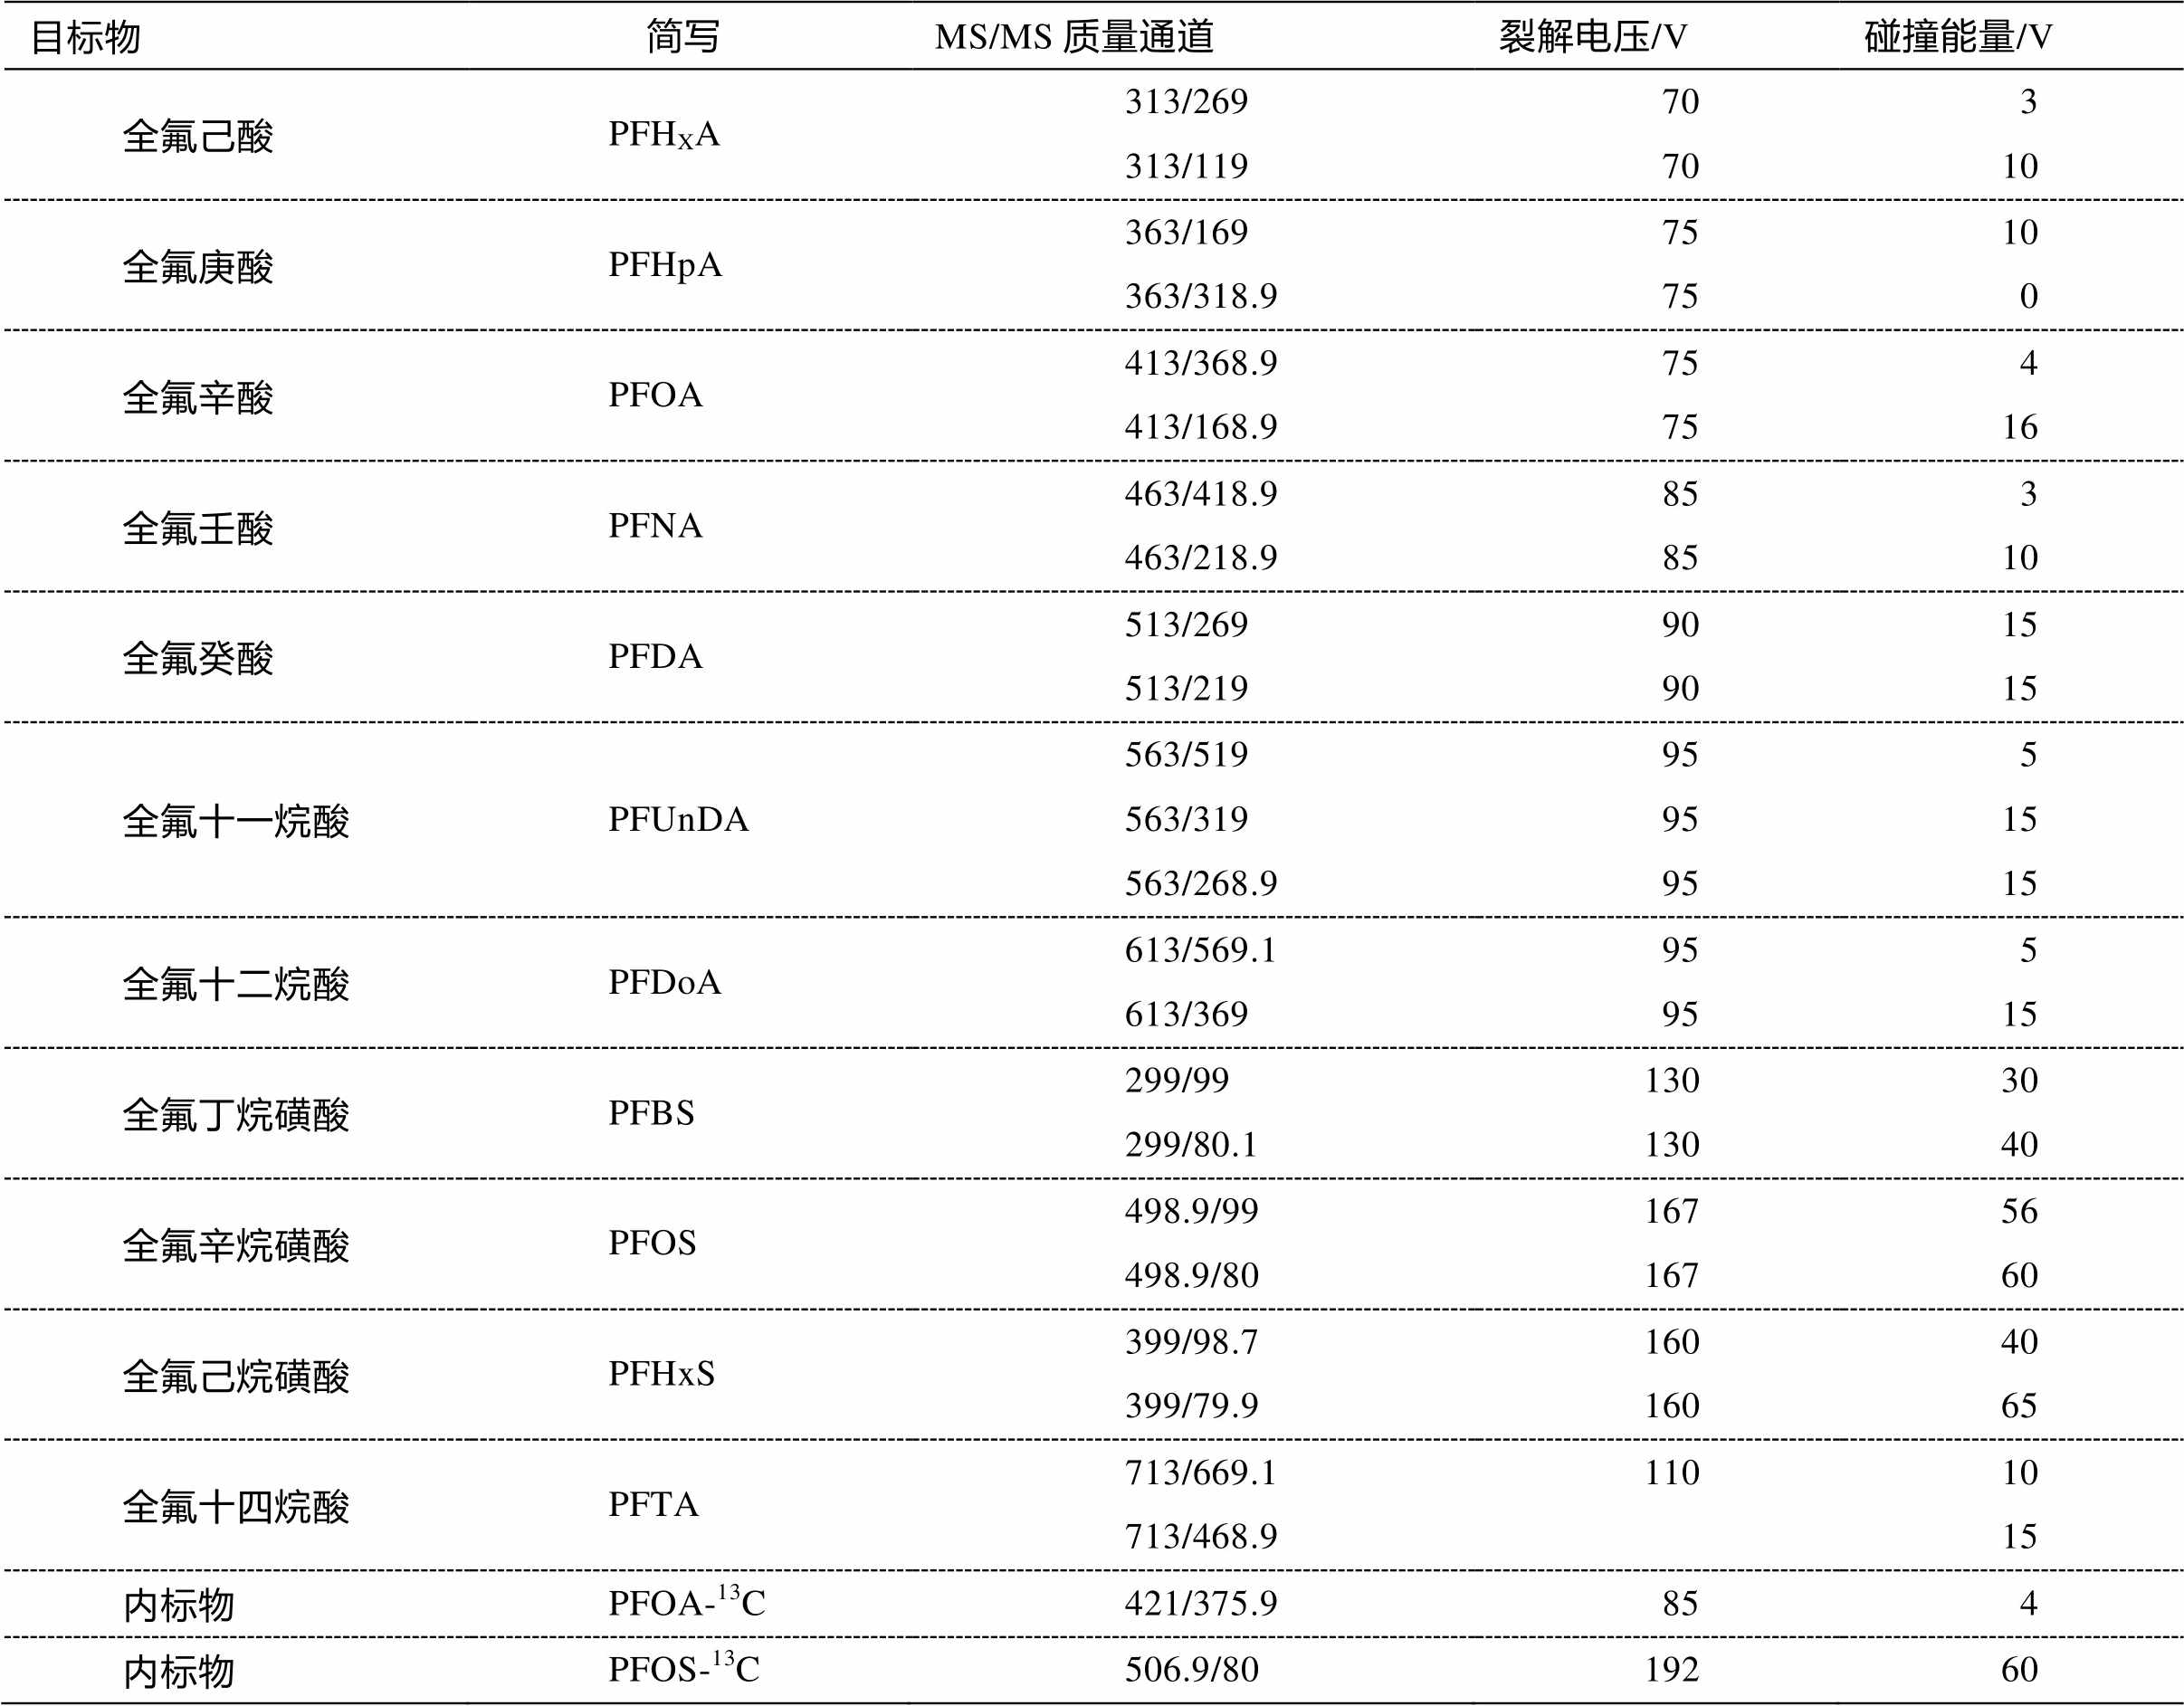
目标物简写MS/MS质量通道裂解电压/V碰撞能量/V 全氟己酸PFHXA313/269703 313/1197010 全氟庚酸PFHpA363/1697510 363/318.9750 全氟辛酸PFOA413/368.9754 413/168.97516 全氟壬酸PFNA463/418.9853 463/218.98510 全氟癸酸PFDA513/2699015 513/2199015 全氟十一烷酸PFUnDA563/519955 563/3199515 563/268.99515 全氟十二烷酸PFDoA613/569.1955 613/3699515 全氟丁烷磺酸PFBS299/9913030 299/80.113040 全氟辛烷磺酸PFOS498.9/9916756 498.9/8016760 全氟己烷磺酸PFHxS399/98.716040 399/79.916065 全氟十四烷酸PFTA713/669.111010 713/468.915 内标物PFOA-13C421/375.9854 内标物PFOS-13C506.9/8019260
其中, RQ 为风险商值, MEC 为全氟化合物的检测浓度(ng/L), PNEC 为预测无效应浓度(ng/L)。RQ<0.1为低风险; 0.1≤RQ<1 为中等风险; RQ≥1 则为高风险[20]。
2 结果与讨论
2.1 观澜河干流水体中PFCs的含量与组成
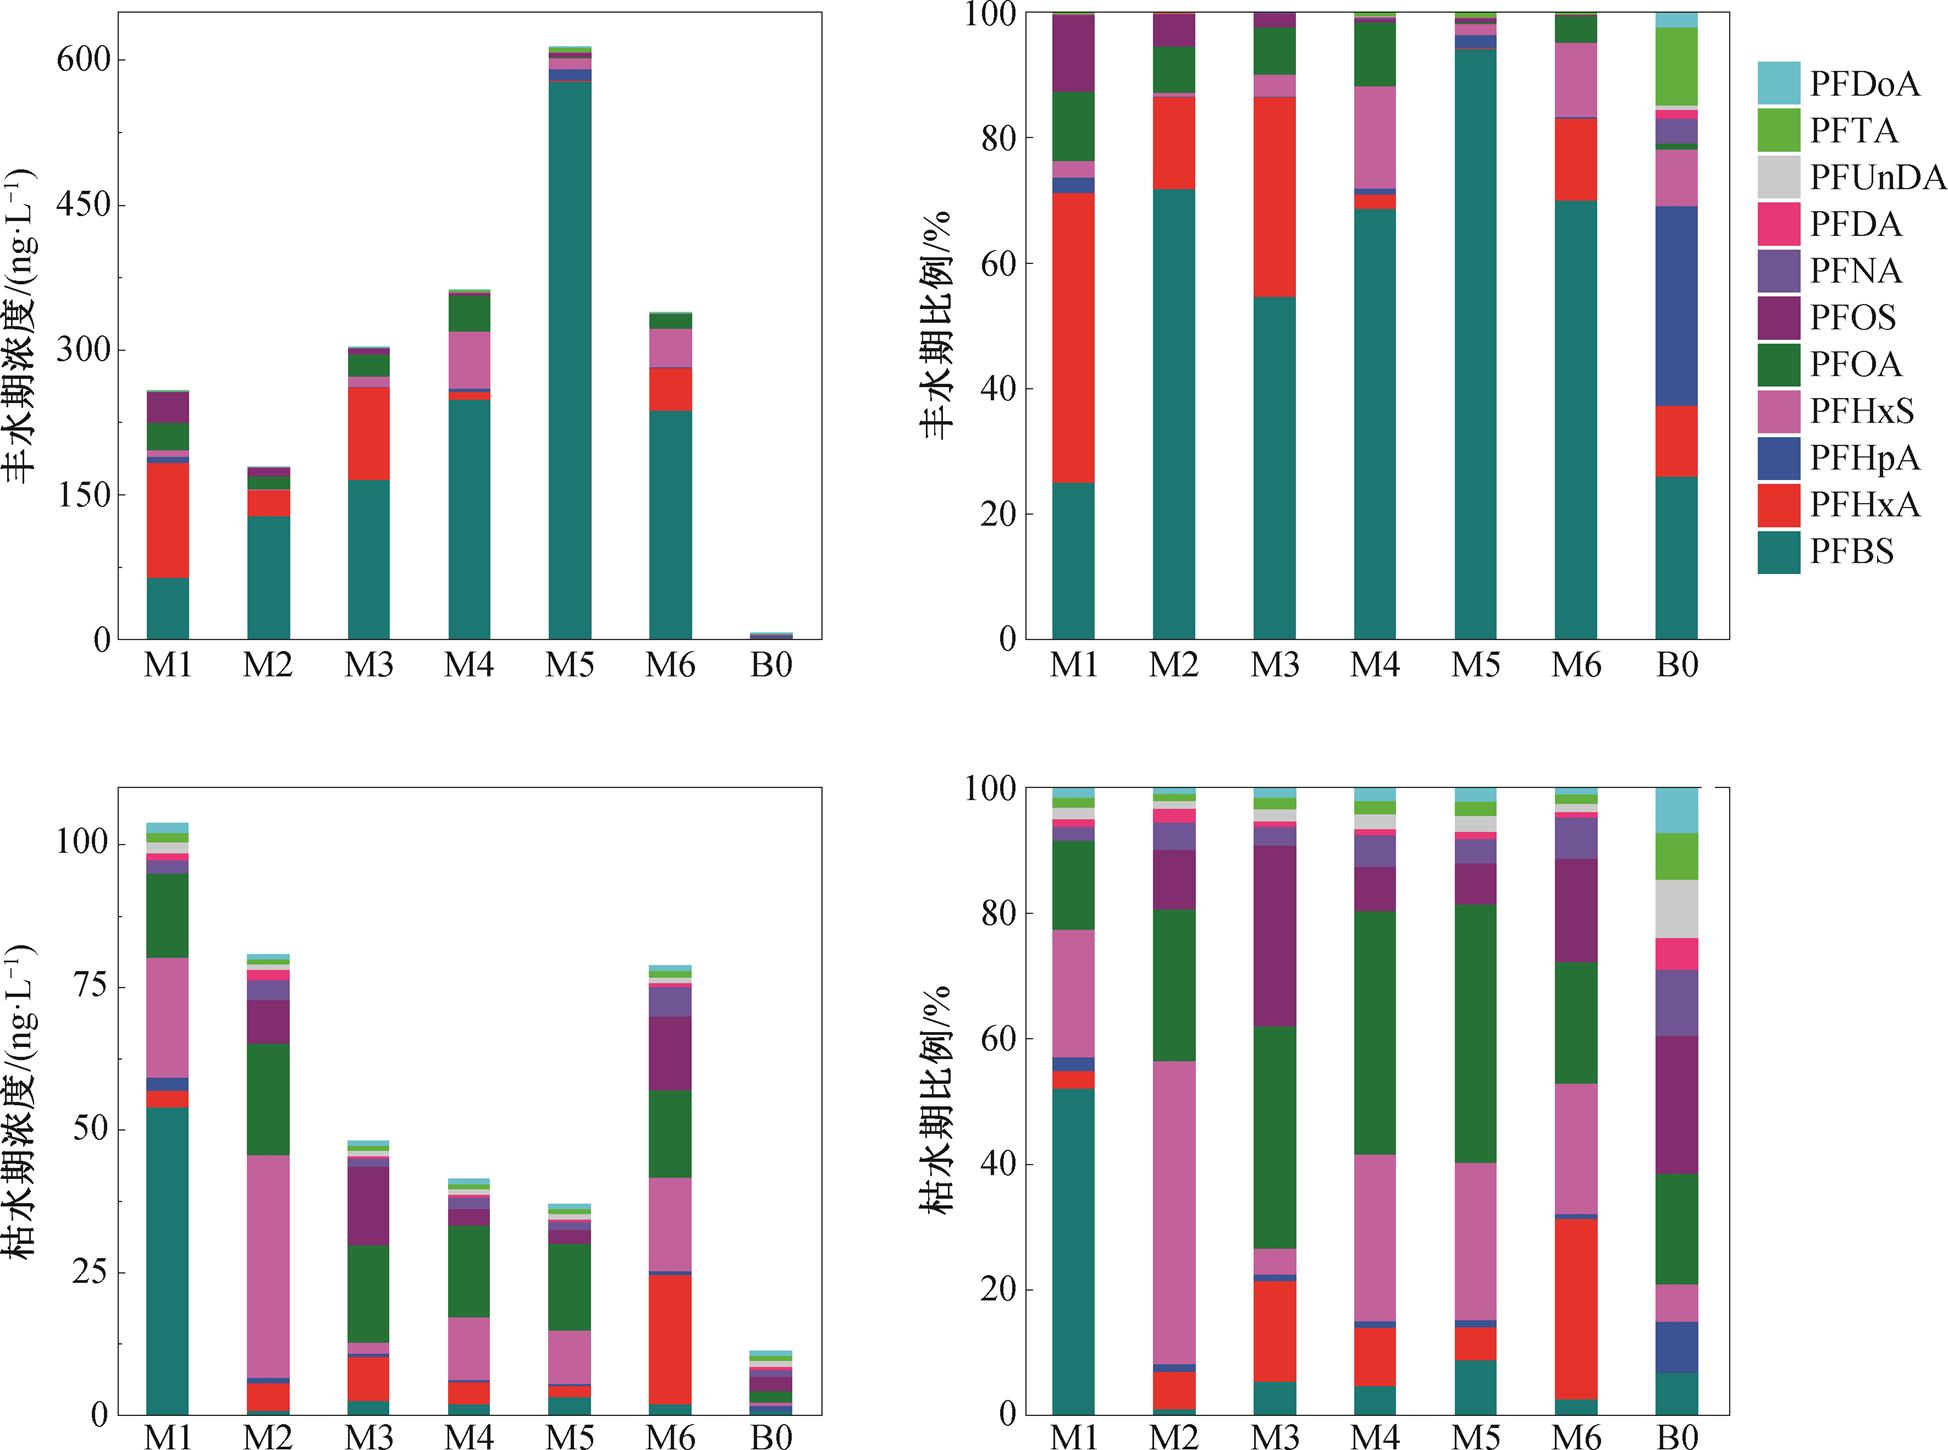
图 2 给出观澜河流域全氟化合物的污染情况。对∑11PFCs 浓度而言, 除 B0(水库出水, PFCs 含量较低, 丰水期为 6.85ng/L, 枯水期为 11.28ng/L)外, 丰水期观澜河中 PFCs 的浓度变化范围为 179.15~ 613.68ng/L, 平均浓度为 342.84ng/L, 最高浓度在M5 检出, 可能是由该点补充的观澜污水处理厂(观澜河流域最大的污水处理厂)的出水引入。有研究表明污水处理厂是 PFCs 的重要汇聚场所之一[21], 污水处理厂出水中 PFCs 含量为 ng/L 或 μg/L[15]浓度水平, 残留的 PFCs 会进入水体[22]。枯水期干流中PFCs 总浓度变化范围为 37.04~103.70 ng/L, 平均浓度为 65.01ng/L, 最高浓度在 M1 检出, 可能与 该点周边制衣厂等企业大量废水排放有关。丰水期PFCs 的检出浓度远高于枯水期, 可能是因为丰水期大量地表径流和雨水冲刷将工业区周边污染物带入水体。同时, 丰水期和枯水期观澜河水体中检出的 PFCs 浓度远远高于水库出水中 PFCs 浓度。
丰水期仅 PFNA 和 PFTA 的检出率为 83.3%, 其余物质的检出率为 100%; 枯水期仅 PFOS 的检出率为 83.3%, 其余物质检出率为 100%, 表明 PFCs 在观澜河流域中广泛存在。丰水期检出浓度最高的是PFBS (64.79~577.74ng/L), 对总浓度的贡献率为25.1%~94.2%, 其次是PFHxS (1.08~59.03 ng/L), 对总浓度的贡献率是 0.6%~37.0%, 研究结果与 Shao等[8]对双台子河, Möller等[1]对莱茵河的研究结果相似。其他研究广泛检出的 PFOA 和 PFOS 在观澜河丰水期水体中含量较低(平均值分别为 11.14 和 10.11ng/L), 对总浓度的贡献率也较低, 分别为0.2%~11.0%和 0.2%~12.2%, 与前人的研究结果有差异[23–25]。枯水期检出浓度最高的是 PFHxS(1.98~39.08ng/L), 对总浓度的贡献率为 4.1%~48.4%, 其次是 PFOA (14.65~19.55ng/L)和 PFOS (0~13.83ng/L),对总浓度的贡献率分别为 14.1%~41.2%和 0~28.7%; 枯水期PFOA 和 PFOS 的贡献率与已报道的结果[23–25]相当。PFBS 仅在枯水期采样点 M1 检出较高浓度, 在其余采样点的含量低于 3.28 ng/L。说明随着时间的推移, 观澜河流域 PFCs 的使用从 PFOA 和 PFOS 逐渐过渡到短链 PFBS。
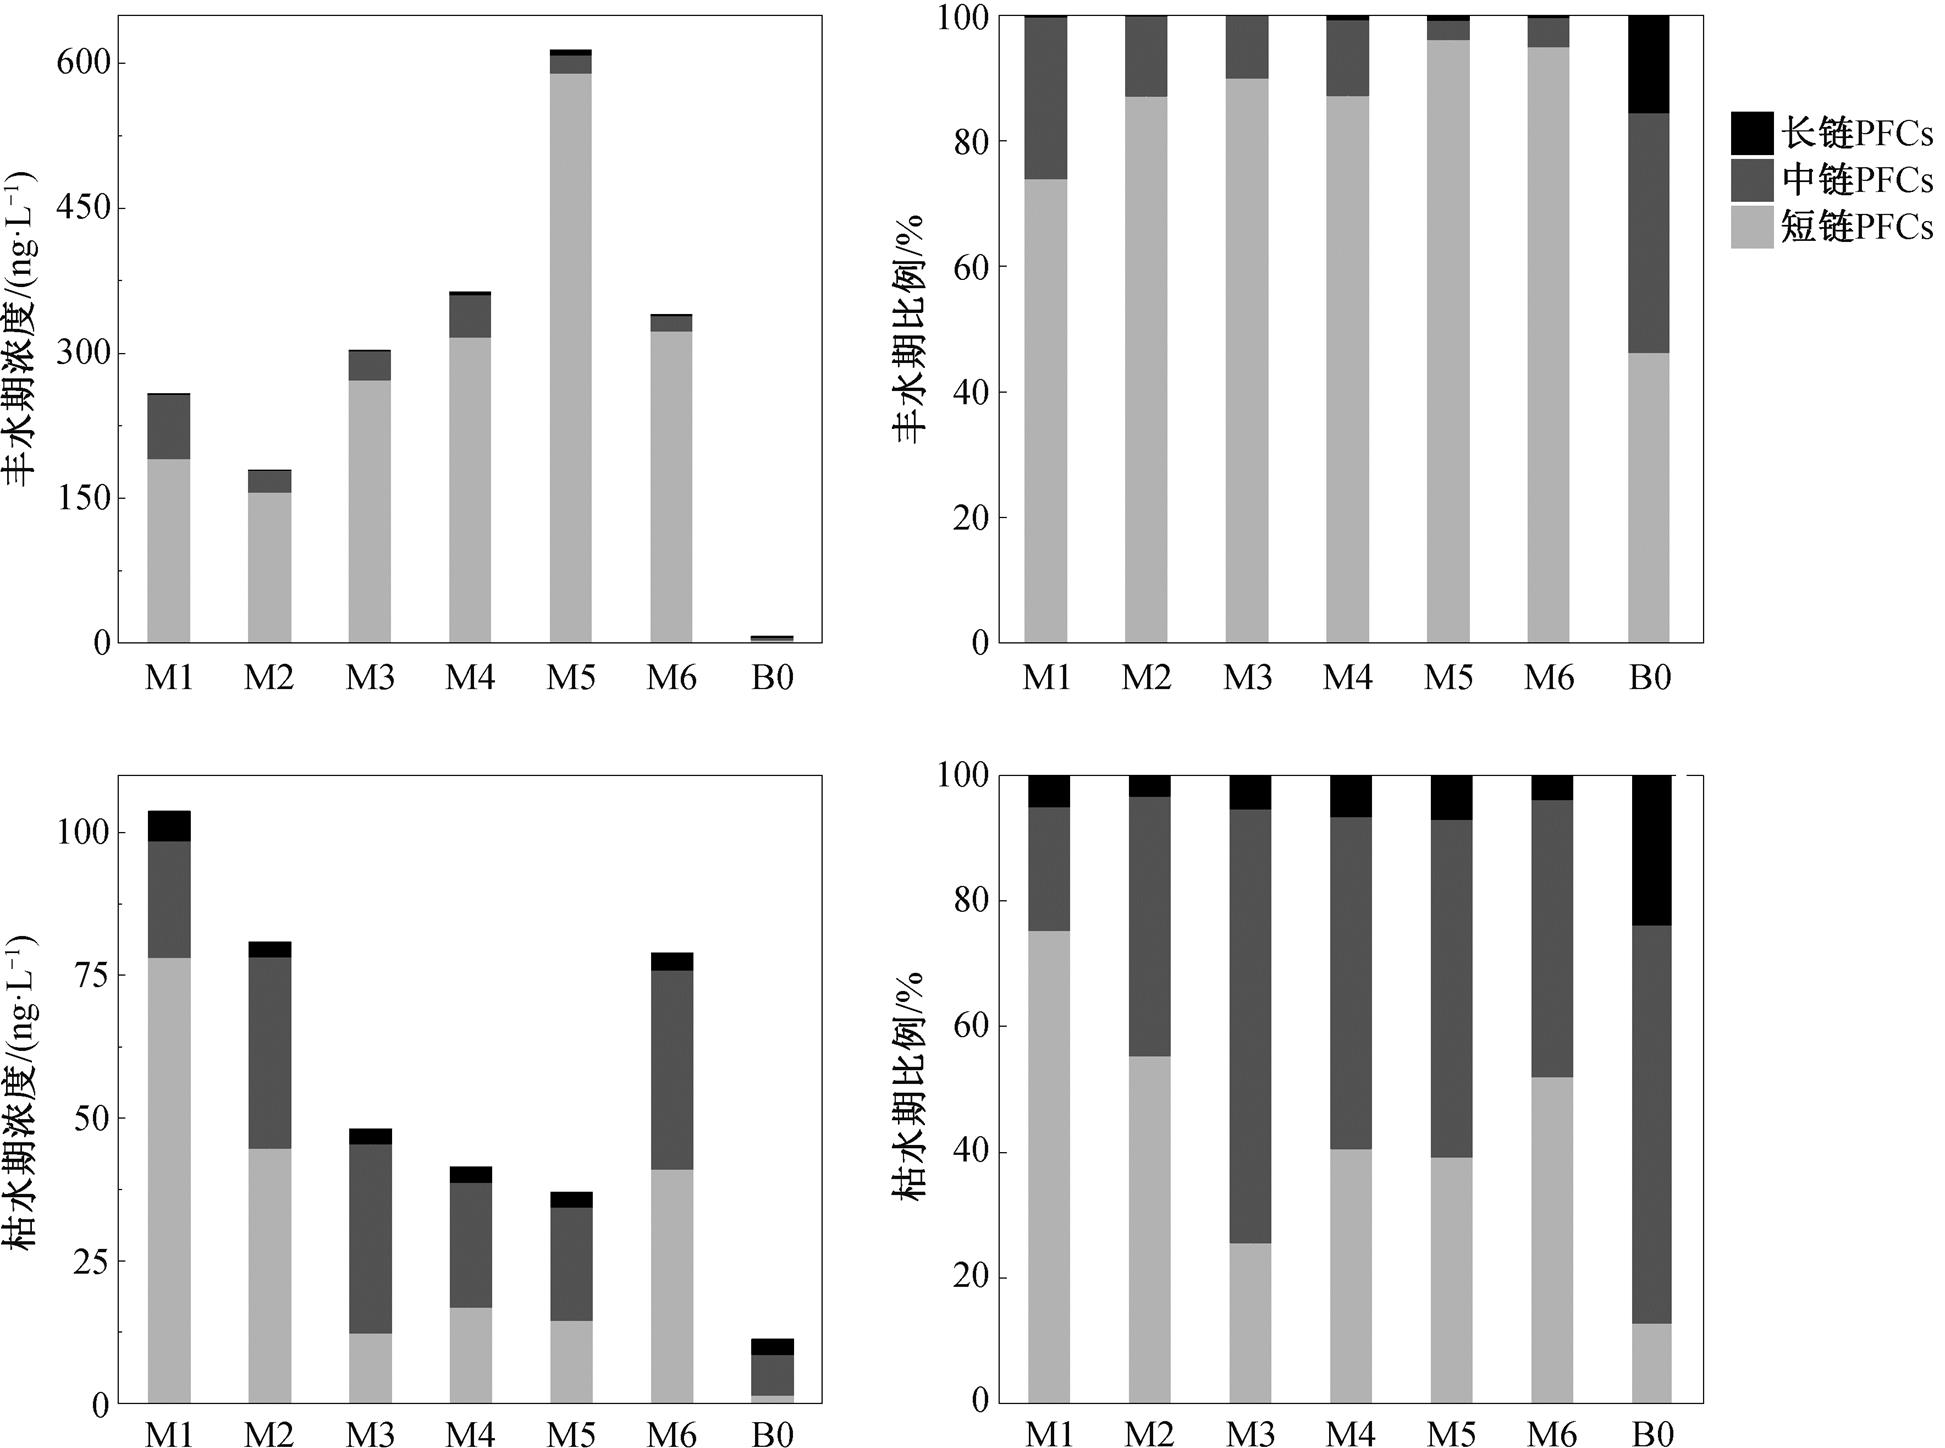
检出的 PFCs 中包括 3 种全氟烷基磺酸(PFSAs)以及 8 种全氟烷基羧酸(PFCAs)。在 PFSAs 中, 丰水期检出含量最高的是 PFBS, 其次是 PFHxS, 这与N-甲基全氟丁烷磺酰氨基乙醇(Me FBSE)以及其他相关全氟四碳化合物的增产有关[11]; 枯水期主要检出的是 PFHxS, 同样作为 PFOS 的替代物在使用。PFCAs 在两期水样中检出浓度较高的均是 PFHxA和 PFOA, 可能因为降雨和污水处理厂出水中有较高含量。从碳链长度看, 长链 PFCs(C≥11)的浓度<中链 PFCs (7≤C≤10)的浓度<短链 PFCs(C≤6)的浓度(图 3)。丰水期, 短链占 PFCs 总量的 42.7%~96.1%, 中链占 PFCs 总量的 3.1%~38.2%, 长链占 PFCs总量的 0.04%~15.5%; 枯水期, 短链占 PFCs 总量的25.6%~75.3%, 中链占 PFCs 总量的 19.9%~34.8%, 长链占 PFCs 总量的 2.6%~5.2%。可见短链 PFCs 是观澜河中存在的主要污染物, 可能与短链的使用量大及其沉积物水分配系数低, 比中长链 PFCs 更易溶于水有关[26–28]。总体而言, 丰水期观澜河中主要检出的物质是 PFBS, PFHxS 和 PFHxA, 枯水期主要检出的物质是 PFHxS, PFHxA, PFOA 和 PFOS, 表明观澜河流域 PFCs 的使用逐步向短链 PFCs 过渡, PFOA和 PFOS 的替代品逐步得以广泛应用。
2.2 观澜河干流PFCs的时空分布特征
丰水期所有采样点 PFCs 的总浓度均高于枯水期。枯水期 PFOS 和 PFOA 对总浓度的贡献率高于丰水期二者的贡献率, 丰水期 PFBS 对总浓度的贡献率高于枯水期的贡献率。
观澜河干流的 6 个采样点中, 3 个采样点(M2, M3 和 M5)位于污水处理厂出水的补水点, 枯水期这 3 个采样点 PFCs 的浓度比其他非补水点低, 原因可能是污水处理厂对枯水期中主要检出的 PFCs (PFHxS, PFHxA, PFOA 和 PFOS)进行了有效的去除[15,29]。丰水期补水点 PFCs 的浓度高于非补水点, 可能与丰水期的主要检出污染物 PFBS 不能在污水处理厂得到有效去除有关。范庆等[30]的研究表明, 无论是常规处理工艺还是 A2/O 或 A2/O-MBR 处理工艺, 出水中 PFBS 的浓度远高于进水。此外, 在枯水期和丰水期, PFBS 的浓度从上游到下游呈逐渐升高的趋势, 可归因于水体中 PFBS 的沿程富集作用。
丰水期上游河段(M1)和中游河段(M2 和 M3)主要检出的物质是 PFBS 和 PFHxA, 两种物质对总浓度的贡献率超过 70%。下游河段(M4~M6)主要检出的物质是 PFBS 和 PFHxS, 对总浓度的贡献率超过80%, 其中 PFBS 含量超过总含量的 68%, 可见, 丰水期主要以短链 PFCs 的使用为主。枯水期上游河段主要污染物是 PFBS, PFHxS 和 PFOA, 对总浓度的贡献率超过 85%; 中下游河段主要污染物为PFHxS, PFHxA, PFOA 和 PFOS, 四者对总浓度的贡献达到 80%以上, 可见, 枯水期除使用短链 PFCs外, 仍在使用中链 PFCs。上述结果进一步证实整个流域PFCs使用方向的转变。
表 4 比较观澜河流域与国内外其他河流域的PFCs 浓度。本研究的 PFCs平均值远远高于国内外其他水体, 表明观澜河流域处于较高的污染水平。本研究的PFOS 和 PFOA 处于中等污染水平, 低于中国中东部地区和其他亚洲地区, 高于珠江三角洲地区和欧洲、美洲地区(如莱茵河和东江地表水中的 PFOA和 PFOS 的含量低于本研究)。本研究主要检出的 PFBS, PFHxA 和 PFHxS 在国内外均处于高污染水平。
2.3 水体中PFCs的污染来源分析
本文利用比值法对 PFCs 潜在污染来源进行定性分析,主要使用 PFOS/PFOA, PFOA/PFNA 和PFHpA/PFOA 这 3 个比值。PFOS/PFOA 值大于 1 表示是 PFOS 的点源污染, 小于 1 则表明是降雨输入。PFOA/PFNA 值在 7~15 之间表明是工业生产的直接排放, 大于 15 则表示前驱体发生降解。PFHpA/ PFOA 值大于 1 表明存在大气沉降, 小于 1 则表明大气沉降不是主要污染源[10,33]。丰水期和枯水期的结果见表 5, 可以看出, 枯水期 M1 和 M4 的 PFOS/ PFOA 大于 1, 丰水期 M1 和 M5 的 PFOS/PFOA 大于 1, 表明这些采样点存在PFOS 的点源污染, 比如电镀金属工业(实地调查发现这几个采样点周边存在电镀金属工业分布)。其余采样点 PFOA的主要污染来源是大气降雨。从 PFOA/PFNA 值来看, 枯水期只有 M3 介于 7~15 之间, 表明该采样点存在工业生产的直接排放, 但前驱体的降解来源极少; 丰水期大多数采样点 PFOA/PFNA 值大于 15, 说明丰水期 PFCs 前驱体的降解是主要污染来源。丰水期和枯水期所有采样点的 PFHpA/PFOA 值均小于 1(丰水期 M5 和 B0 除外), 表明观澜河中 PFCs 的大气沉降来源极少, 同样也表明污水排放是观澜河水体中PFCs的主要来源。
表4 国内外水体中PFCs的浓度分布(ng/L)
Table 4 Concentrations of PFCs in Chinese and global water body (ng/L)
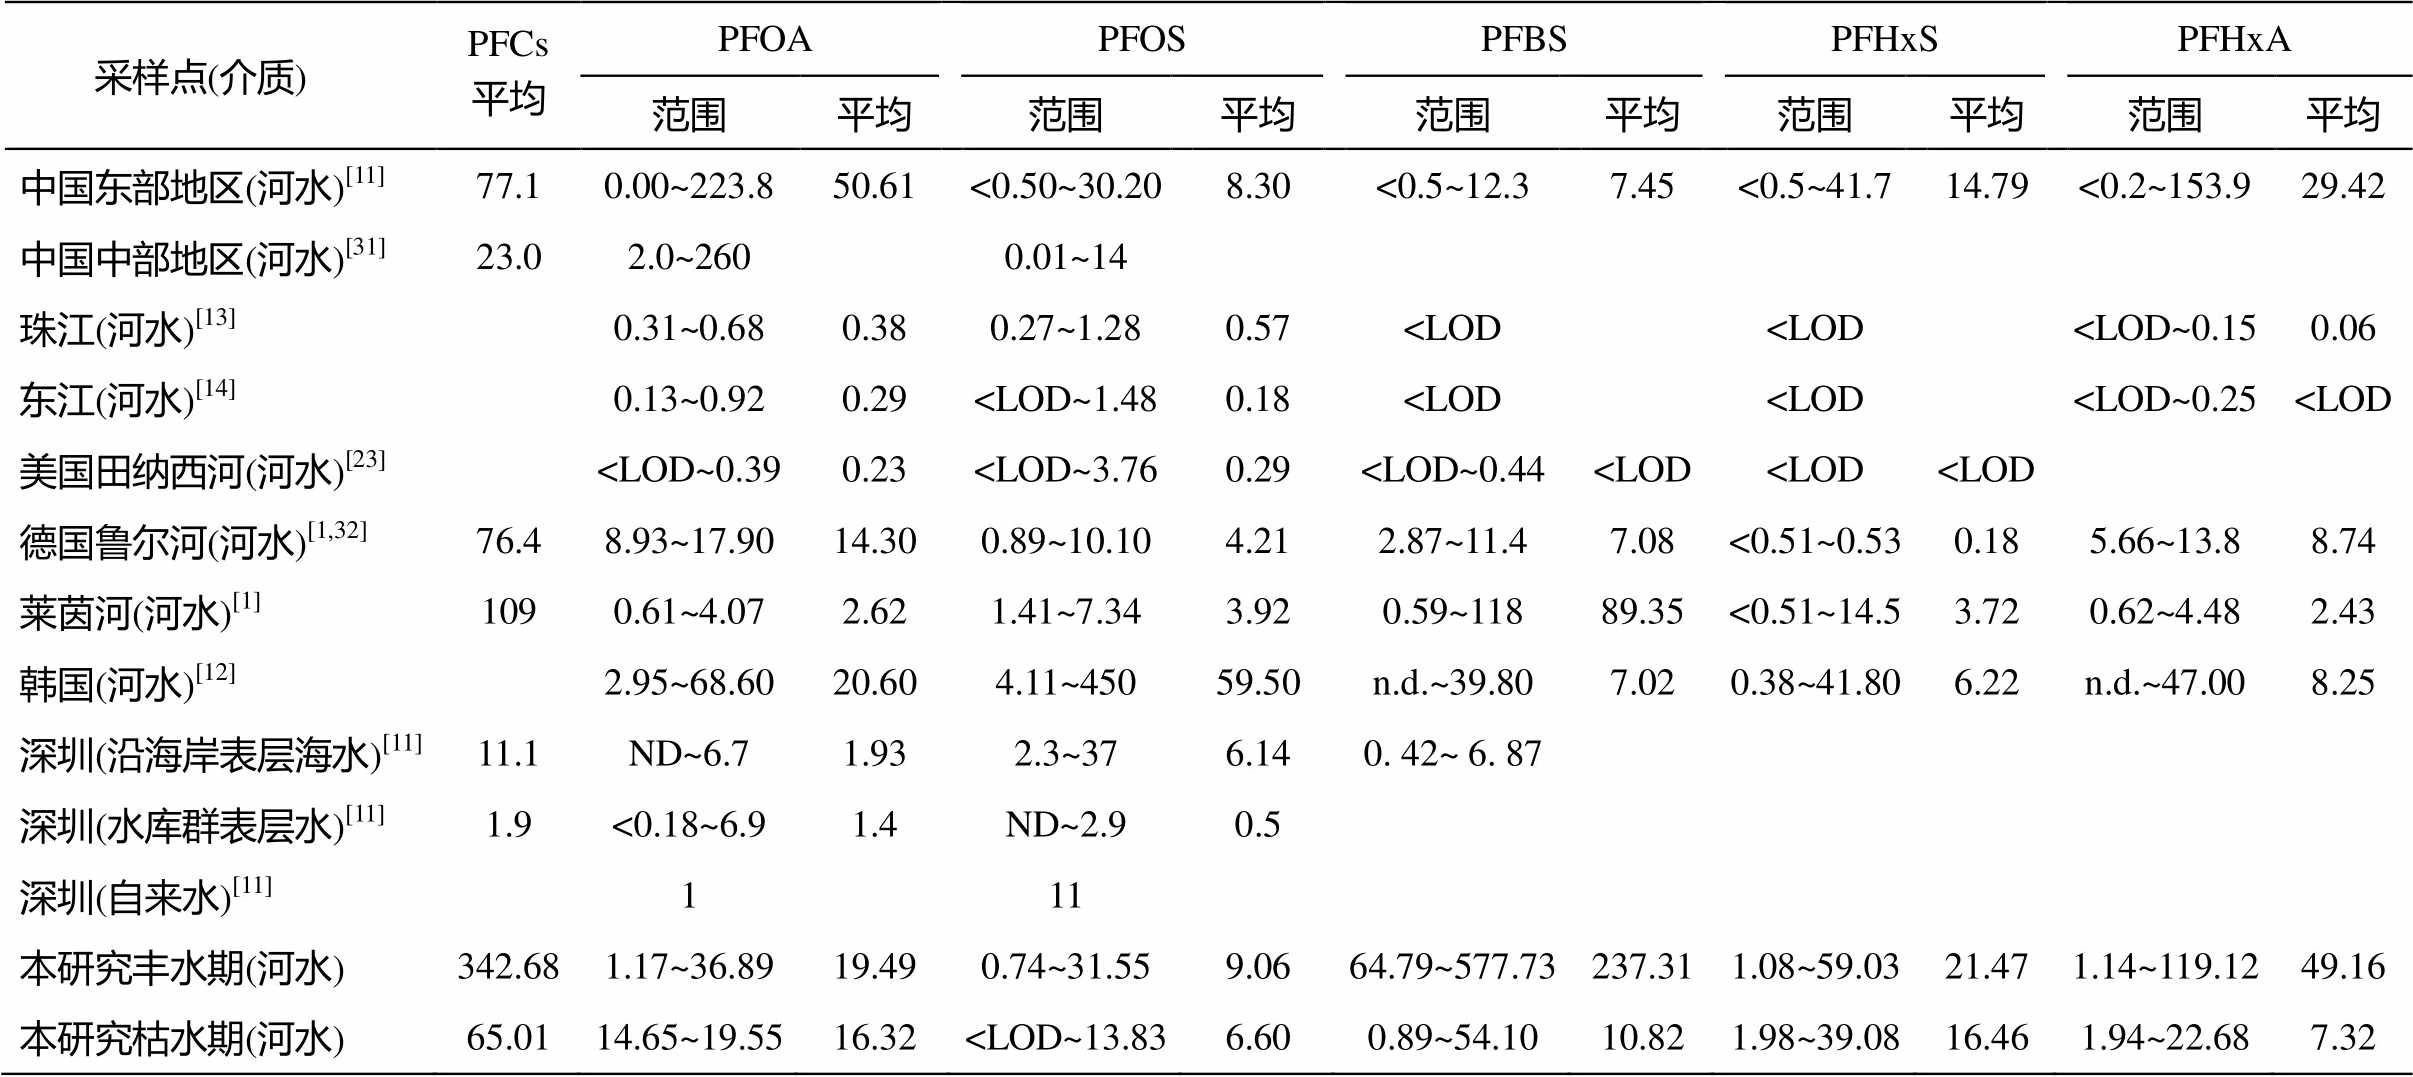
采样点(介质)PFCs平均PFOAPFOSPFBSPFHxSPFHxA 范围平均范围平均范围平均范围平均范围平均 中国东部地区(河水)[11]77.10.00~223.850.61<0.50~30.208.30<0.5~12.37.45<0.5~41.714.79<0.2~153.929.42 中国中部地区(河水)[31]23.02.0~2600.01~14 珠江(河水)[13]0.31~0.680.380.27~1.280.57
表5 观澜河水体中PFCs特征单体比值
Table 5 Ratios of characteristic monomers of PFCs in Guanlan River
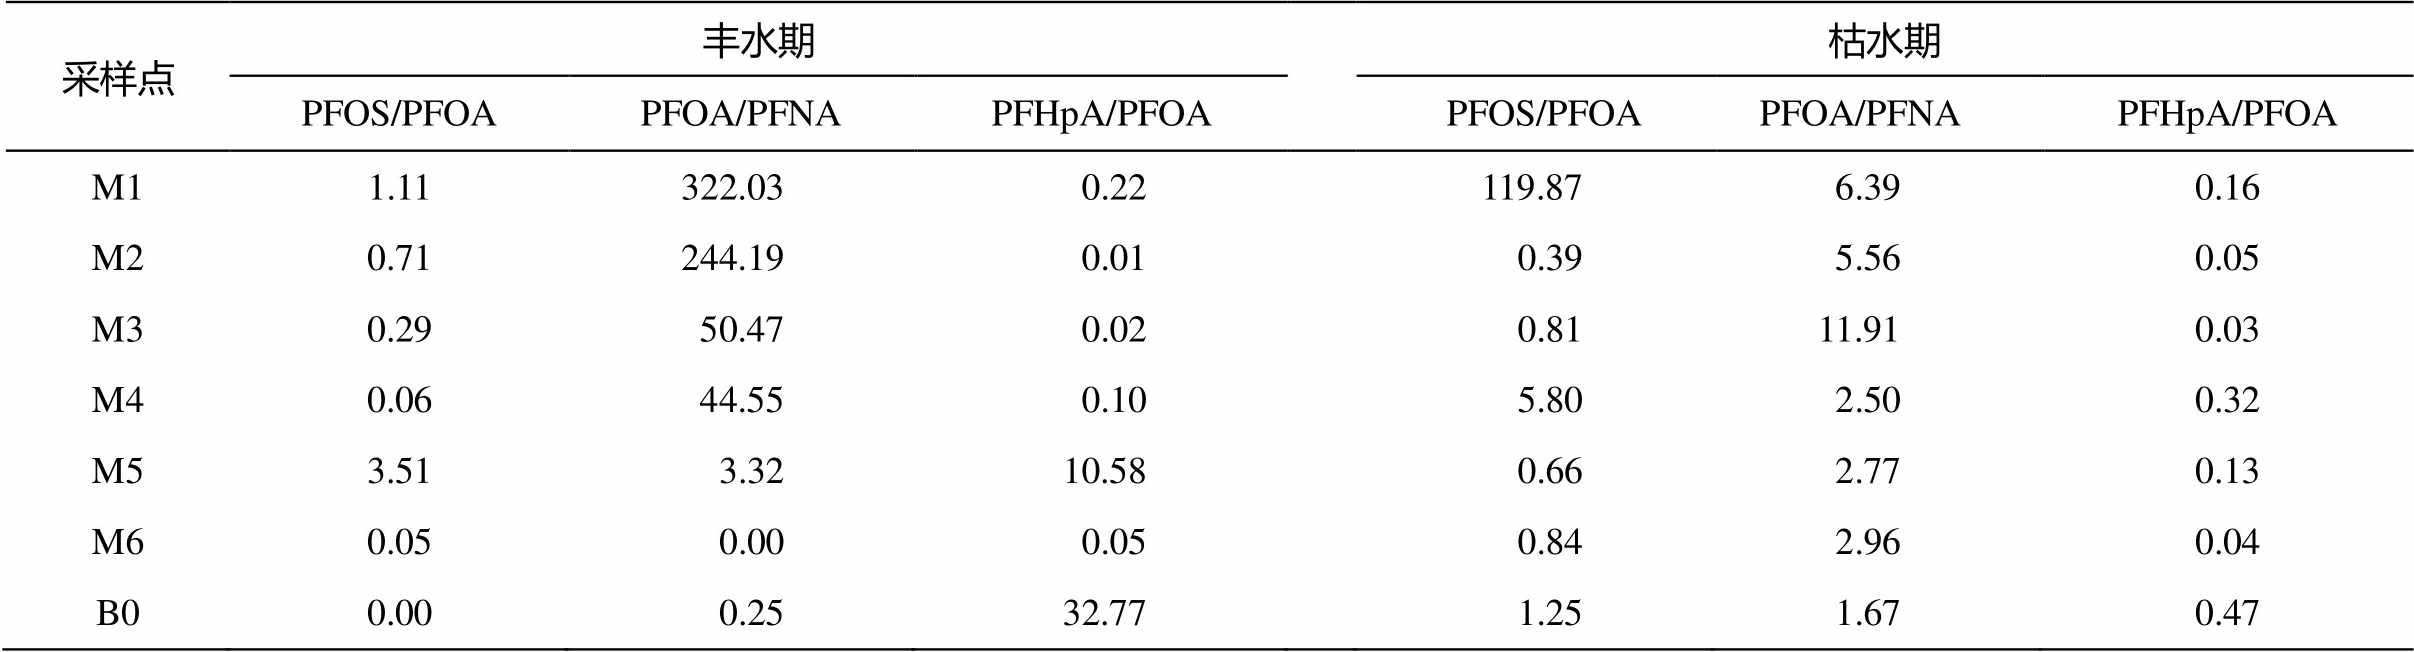
采样点丰水期枯水期 PFOS/PFOAPFOA/PFNAPFHpA/PFOAPFOS/PFOAPFOA/PFNAPFHpA/PFOA M11.11322.030.22119.876.390.16 M20.71244.190.010.395.560.05 M30.2950.470.020.8111.910.03 M40.0644.550.105.802.500.32 M53.513.3210.580.662.770.13 M60.050.000.050.842.960.04 B00.000.2532.771.251.670.47
此外, 观澜河中检出浓度较高的 PFBS, PFHxA 和 PFHxS, 主要来源可能与研究区域周边纺织厂、造纸厂、皮革厂和食品包装等行业大量使用的防水防油剂及整理助剂的主要成分有关[34]。皮革工业和食品包装材料中主要的成分是 PFHxA, 且该物质在污水处理厂进出水中也广泛存在。因此, 观澜河中 PFHxA 的污染来源可能是未经处理的生活污水及污水处理厂出水[35]。PFHxS 在工业上用于水性成膜泡沫(AFFF)和地毯处理剂[34], 其污染来源可能是直接工业排放或通过污水处理厂出水间接排放。
2.4 水体中PFCs的生态风险分析
根据 Brooke 等[36]、曹莹等[37]和 Sun 等[38]的研究结果, PFOA, PFOS, PFNA, PFHxA 和 PFDA 在水体中的 PNEC 值分别为 570000, 25000, 100000, 97000 和 11000 ng/L。本研究通过风险商值评估水体中 PFOA, PFOS, PFNA, PFHxA 和 PFDA 的生态风险(表 6), 结果显示, PFOA, PFOS, PFNA, PFHxA和 PFDA 的 RQ 值远远小于 0.1, 表明观澜河水体中这些全氟化合物对水生生物(鱼类)不会造成生态风险。
3 结论
观澜河流域中普遍检出 PFCs 化合物。丰水期和枯水期 PFCs 的总浓度变化范围分别为 163.73~ 618.63 和 31.39~383.70 ng/L。丰水期检出浓度最高的是 PFBS(64.79~577.74ng/L), 对总浓度的贡献率为 25.1%~94.2%; 其次是 PFHxS, 对总浓度的贡献率为 0.6%~37.0%。枯水期 PFHxS 的检出浓度最高(1.98~39.08ng/L), 其次是 PFOA, PFOS 和PFHxA, 四者对总浓度的贡献达到 80%以上。与丰水期相比, 枯水期 PFBS 的检出浓度均很低, 表明中长链 PFCs 的替代品得到越来越广泛的应用。丰水期 PFCs 的空间分布呈现补水点浓度高于非补水点的趋势, 枯水期呈现补水点浓度低于非补水点的趋势, 可能与两季水体主要检出的污染物在污水处理厂的去除率有关。污染来源分析表明, 电镀防雾剂、食品包装、纺织厂、造纸厂和皮革厂等行业的生产过程、大气沉降以及污水处理厂出水是观澜河PFCs 的主要来源。生态风险评估表明, PFCs 对观澜河流域不会造成生态风险。
表6 观澜河水体中PFOA, PFOS, PFNA, PFHxA和PFDA的生态风险商值
Table 6 Ecological risk quotients of PFOA, PFOS, PFNA, PFHxA and PFDA in Guanlan River
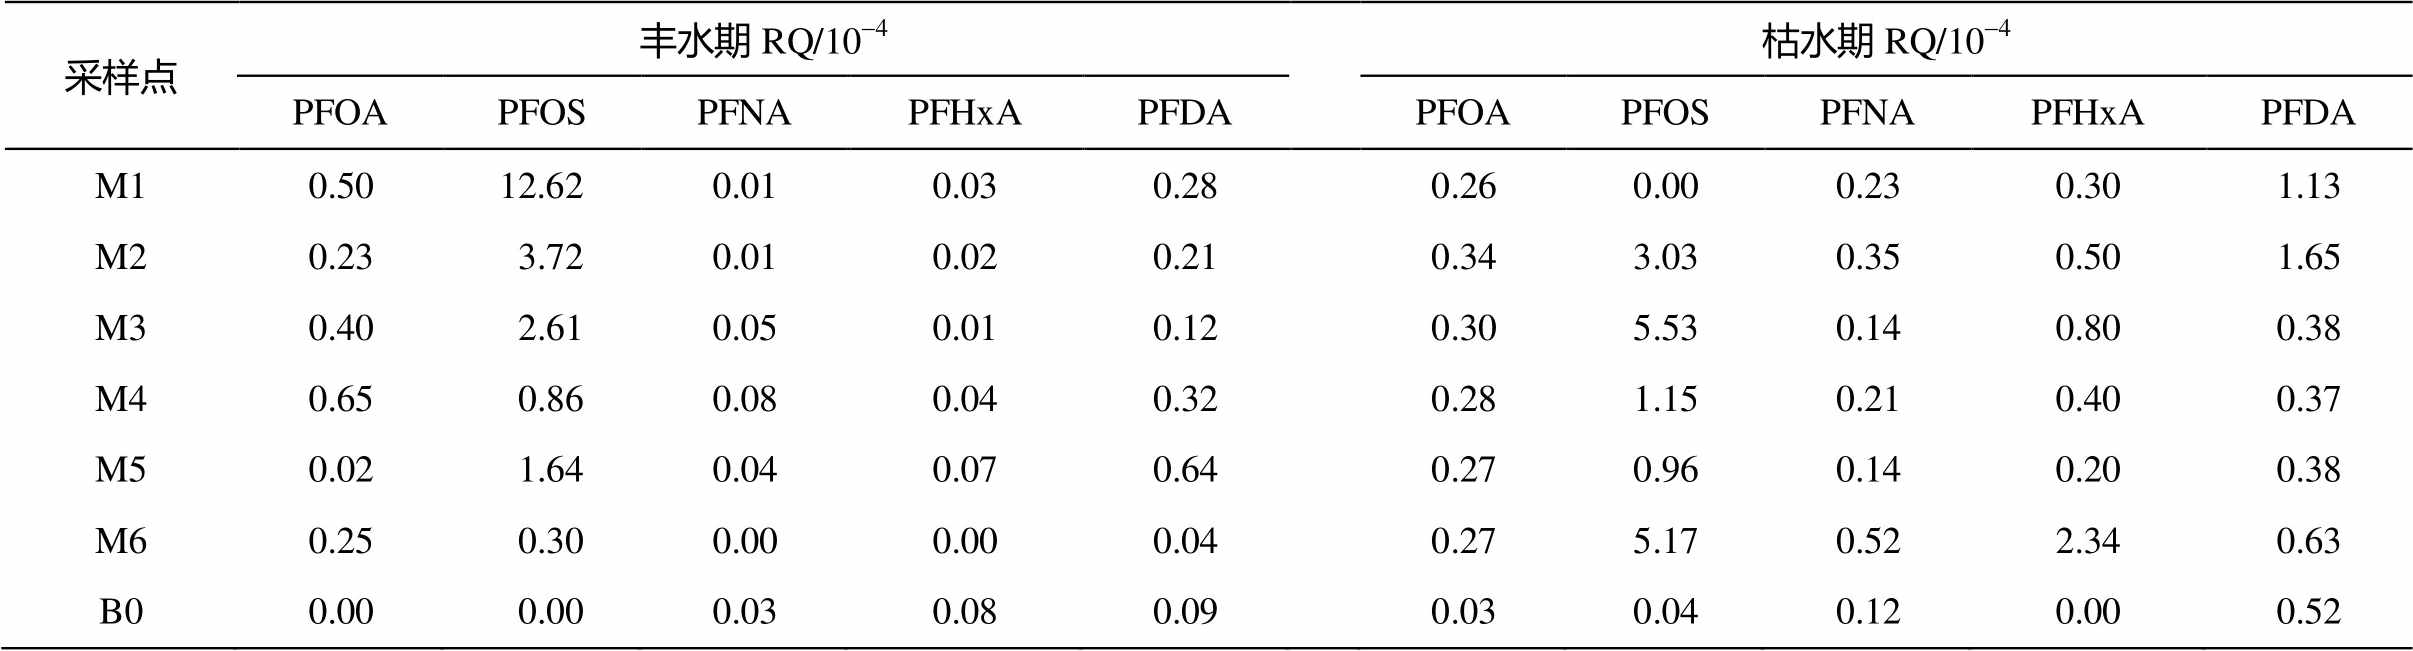
采样点丰水期RQ/10-4枯水期RQ/10-4 PFOAPFOSPFNAPFHxAPFDAPFOAPFOSPFNAPFHxAPFDA M10.5012.620.010.030.280.260.000.230.301.13 M20.233.720.010.020.210.343.030.350.501.65 M30.402.610.050.010.120.305.530.140.800.38 M40.650.860.080.040.320.281.150.210.400.37 M50.021.640.040.070.640.270.960.140.200.38 M60.250.300.000.000.040.275.170.522.340.63 B00.000.000.030.080.090.030.040.120.000.52
参考文献
[1]Möller A, Aherens L, Surm R, et al. Distribution and sources of polyfluoroalkyl substances (PFAS) in the River Rhine watershed. Environmental Pollution, 2010, 158(10): 3243–3250
[2]Elmonznino J A. Occurrence, fate and distribution behaviors of organic contaminants, perfluorinated alkyl acids and phthalic acid esters, in wastewater effluent and the Housatonic River Estuary [D]. Storrs, CT: University of Connecticut, 2016
[3]Clara M, Gans O, Weiss S, et al. Perfluorinated alkylated substances in the aquatic environment: an Austrian case study. Water Research, 2009, 43(18): 4760–4768
[4]Hu X C, Andrews D Q, Lindstrom A B, et al. Detection of poly- and perfluoroalkyl substances (PFASs) in U.S. drinking water linked to industrial sites, military fire training areas, and wastewater treatment plants. Environmental Science & Techno-logy Letters, 2016, 3(10): 344–350
[5]Nguyen T V, Reinhard M, Chen H, et al. Fate and transport of perfluoro- and polyfluoroalkyl substances including perfluorooctane sulfonamides in a managed urban water body. Environmental Science and Pollu-tion Research International, 2016, 23(11): 10382–10392
[6]Post G B, Louis J B, Lippincott R L, et al. Occurrence of perfluorinated compounds in raw water from New Jersey public drinking water systems. Environmental Science & Technology, 2013, 47(23): 13266–13275
[7]Qi Y, Huo S, Hu S, et al. Identification, characteri-zation, and human health risk assessment of perfluo-rinated compounds in groundwater from a suburb of Tianjin, China. Environmental Earth Sciences, 2016, 75(5): 432–444
[8]Shao M, Ding G, Zhang J, et al. Occurrence and distribution of perfluoroalkyl substances (PFASs) in surface water and bottom water of the Shuangtaizi Estuary, China. Environmental Pollution, 2016, 216: 675–681
[9]Zhang Y Z, Wang B, Wang W, et al. Occurrence and source apportionment of per- and poly-fluorinated compounds (PFCs) in North Canal Basin, Beijing. Scientific Reports, 2016, 6: 36683–36693
[10]Wang T, Kim J S, Chen C, et al. Perfluorinated compounds in surface waters from Northern China: comparison to level of industrialization. Environment International, 2012, 42(1): 37–46
[11]Cai M, Zhao Z, Yang H, et al. Spatial distribution of per- and polyfluoroalkyl compounds in coastal waters from the East to South China Sea. Environmental Pollution, 2012, 161(1): 162–169
[12]Naile J E, Khim J S, Wang T, et al. Perfluorinated compounds in water, sediment, soil and biota from estuarine and coastal areas of Korea. Environmental Pollution, 2010, 158(5): 1237–1244
[13]Liu B, Zhang H, Xie L, et al. Spatial distribution and partition of perfluoroalkyl acids (PFAAs) in rivers of the Pearl River Delta, southern China. Science of the Total Environment, 2015, 524/525: 1–7
[14]Pan C G, Ying G G, Zhao J L, et al. Spatial distribution of perfluoroalkyl substances in surface sediments of five major rivers in China. Archives of Environmental Contamination and Toxicology, 2015, 68(3): 566–576
[15]Sun H, Li F, Zhang T, et al. Perfluorinated compounds in surface waters and WWTPs in Shenyang, China: mass flows and source analysis. Water Research, 2011, 45(15): 4483–4490
[16]Sun Z, Zhang C, Yan H, et al. Spatiotemporal distri-bution and potential sources of perfluoroalkyl acids in Huangpu River, Shanghai, China. Chemosphere, 2017, 174: 127–135
[17]Zhang Y, Lai S, Zhao Z, et al. Spatial distribution of perfluoroalkyl acids in the Pearl River of southern China. Chemosphere, 2013, 93(8): 1519–1525
[18]Li K, He C, Zhuang J, et al. Long-term changes in the water quality and macroinvertebrate communities of a subtropical river in South China. Water, 2014, 7(1): 63–80
[19]Lin T, Yu S, Chen W. Occurrence, removal and risk assessment of pharmaceutical and personal care pro-ducts (PPCPs) in an advanced drinking water treat-ment plant (ADWTP) around Taihu Lake in China. Chemosphere, 2016, 152: 1–9
[20]Li B, Liu R, Gao H, et al. Spatial distribution and ecological risk assessment of phthalic acid esters and phenols in surface sediment from urban rivers in Northeast China. Environmental Pollution, 2016, 219: 409–415
[21]Chen H, Reinhard M, Nguyen T V, et al. Characteri-zation of occurrence, sources and sinks of perfluo-roalkyl and polyfluoroalkyl substances (PFASs) in a tropical urban catchment. Environmental Pollution, 2017, 227: 397–405
[22]Castiglioni S, Valsecchi S, Polesello S, et al. Sources and fate of perfluorinated compounds in the aqueous environment and in drinking water of a highly urba-nized and industrialized area in Italy. Journal of Hazardous Materials, 2015, 282: 51–60
[23]Eldridge J S. Quantitative characterization of trace levels of PFOS and PFOA in the Tennessee River. Environmental Science & Technology, 2002, 36(8): 1681–1685
[24]Lein N P H, Fujii S, Tanaka S, et al. Contamination of perfluorooctane sulfonate (PFOS) and perfluorooc- tanoate (PFOA) in surface water of the Yodo River basin (Japan). Desalination, 2008, 226(1): 338–347
[25]Zhou Y, Tao Y, Li H, et al. Occurrence investigation of perfluorinated compounds in surface water from East Lake (Wuhan, China) upon rapid and selective magnetic solid-phase extraction. Scientific Reports, 2016, 6: 38633–38643
[26]Higgins C P, Luthy R G. Sorption of perfluorinated surfactants on sediments. Environmental Science & Technology, 2006, 40(23): 7251–7256
[27]Kwadijk C J, Korytár P, Koelmans A A. Distribution of perfluorinated compounds in aquatic systems in the Netherlands. Environmental Science & Technology, 2010, 44(10): 3746–3751
[28]Zhang Y, Meng W, Guo C, et al. Determination and partitioning behavior of perfluoroalkyl carboxylic acids and perfluorooctanesulfonate in water and sedi-ment from Dianchi Lake, China. Chemosphere, 2012, 88(11): 1292–1299
[29]王凯, 郭昌胜, 张远, 等. 不同微生物处理工艺对全氟化合物的去除效果. 环境科学研究, 2015, 28 (1): 110–116
[30]范庆, 邓述波, 周琴, 等. 城市污水处理厂中全氟化合物的存在及去除效果研究. 环境污染与防治, 2011, 33(1): 30–35
[31]Chen S, Jiao X C, Gai N, et al. Perfluorinated com-pounds in soil, surface water, and groundwater from rural areas in eastern China. Environmental pollu-tion, 2016, 211: 124–131
[32]Zhao X, Xia X, Zhang S, et al. Spatial and vertical variations of perfluoroalkyl substances in sediments of the Haihe River, China. J Environ Sci (China), 2014, 26(8): 1557–1566
[33]吕佳佩. 辽河水环境中典型持久性有机污染物的污染特征研究[D]. 北京: 中国环境科学研究院, 2015
[34]Möller A, Ahrens L, Sturm R, et al. Identification of point sources of polyfluoroalkyl compounds (PFCs) along the River Rhine watershed and their transpor-tation into the North Sea. 2009
[35]Xiao F, Halbach T R, Simcik M F, et al. Input charac-terization of perfluoroalkyl substances in wastewater treatment plants: source discrimination by exploratory data analysis. Water research, 2012, 46(9): 3101–3109
[36]Brooke D, Footitt A, Nwaogu T A. Environmental risk evaluation report: perflurooctanesulphonate (PFOS). Bioinformatics, 2004, 17(7): 646–653
[37]曹莹, 周腾耀, 刘秀华, 等. 我国环境中全氟辛酸(PFOA)的预测无效应浓度推导. 环境化学, 2013, 7: 1180–1187
[38]Sun R, Wu M, Tang L, et al. Perfluorinated com-pounds in surface waters of Shanghai, China: Source analysis and risk assessment.Ecotoxicology and En-vironmental Safety, 2018, 149: 88–95
Pollution Characteristics and Ecological Risk of Perfluorinated Compounds in a Rapidly Urbanizing Catchment
WANG Zhifen1, LIANG Xinxiu1, ZHAN Bicheng2, WU Jiang1, GAO Yue1, XU Nan1,†
1. Key Laboratory for Heavy Metal Pollution Control and Reutilization, School of Environment and Energy, Peking University Shenzhen Graduate School, Shenzhen 518055; 2. Environmental Protection and Water Affairs Bureau of Longhua District, Shenzhen 518000
Abstract To investigate the pollution characteristics of eleven perfluorinated compounds (PFCs) in a rapidly urbanizing catchment, water samples from the Guanlan River in Shenzhen were collected during the dry season and the wet season. All the samples were pretreated by solid-phase extraction and analyzed using ultra-high performance liquid chromatography-triple quadrupole tandem mass spectrometry with electron spray ionization (UPLC-ESI-MS/MS). The results indicated that the concentrations of PFCs in the mainstream of Guanlan River during the wet season and dry season were 179.15–613.68 and 37.04–103.70 ng/L, respectively. Perfluorohexane sulfonic acid (PFHxS), perfluorobutane sulfonic acid (PFBS), perfluorohexanoic acid (PFHxA), and per-fluorooctanoic acid (PFOA) were the predominant pollutants. The concentration of PFCs in the wet season was higher than that in the dry season, and the concentration of PFCs in the downstream was higher than that in the upper and middle stream. Compared with other water body in the world, the levels of PFCs in Guanlan River were relatively high due to the rapid urbanization in the region. The ecological risk of PFCs to aquatic organisms was neglectable.
Key words perfluorinated compound; urban river; spatio-temporal distribution; source apportionment; risk assessment
† Corresponding author, E-mail: xunan@pkusz.edu.cn
自然科学基金(51579003)、流域生态工程学学科建设项目(深发改[2017]542 号)及深圳市龙华区政府项目(0851-1461SZ01CL87)资助
收稿日期: 2018‒05‒05;
修回日期: 2018‒05‒16;
doi: 10.13209/j.0479-8023.2019.029
†通信作者, E-mail: xunan@pkusz.edu.cn
网络出版日期: 2019‒05‒10
 (1)
(1)